

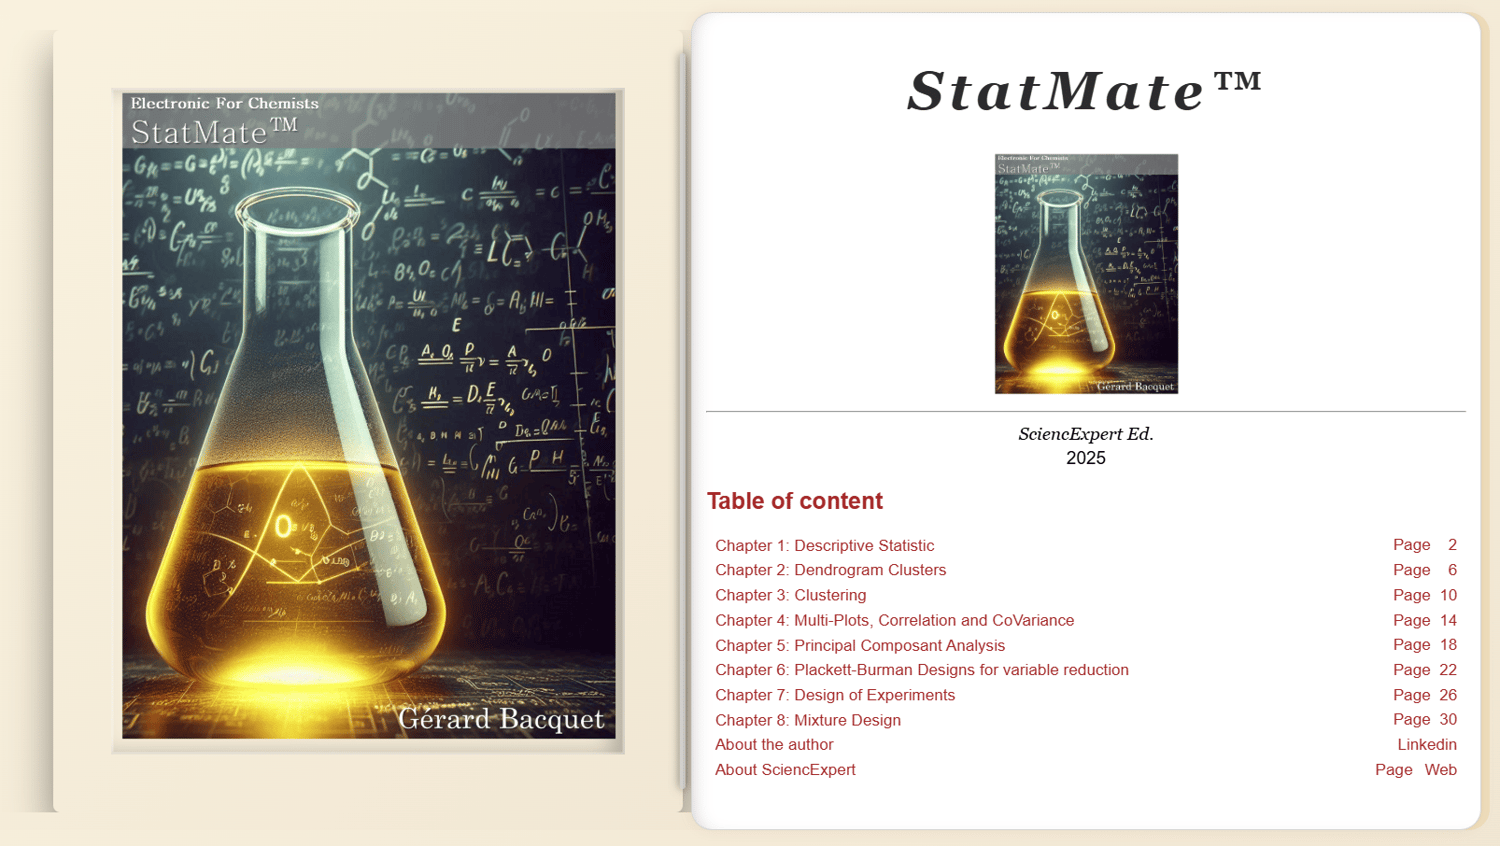


StateMate™ — A Unified Stat Platform for Data Mining
Ebook, licence included - Academics education: discount coupon available on request
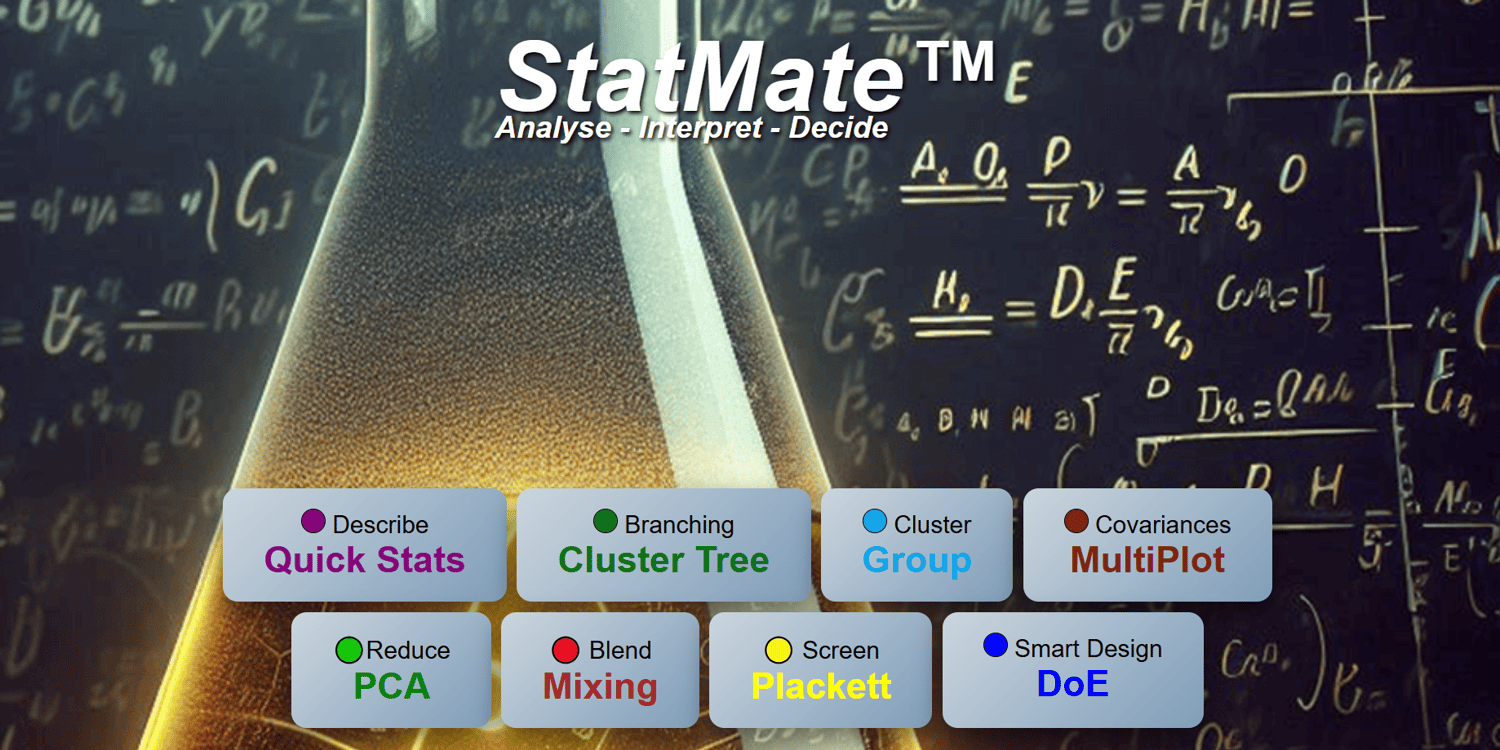
StatMate is an innovative EdTech solution from SciencExpert that helps users to learn, explore and make data-driven decisions. It comprises 8 interactive modules covering descriptive statistics, clustering, dendrograms, correlations/covariances, principal component analysis (PCA), Plackett–Burman analysis, experimental designs and mixture designs.
Designed for higher education and research, StatMate visualises and makes accessible advanced data mining methods.
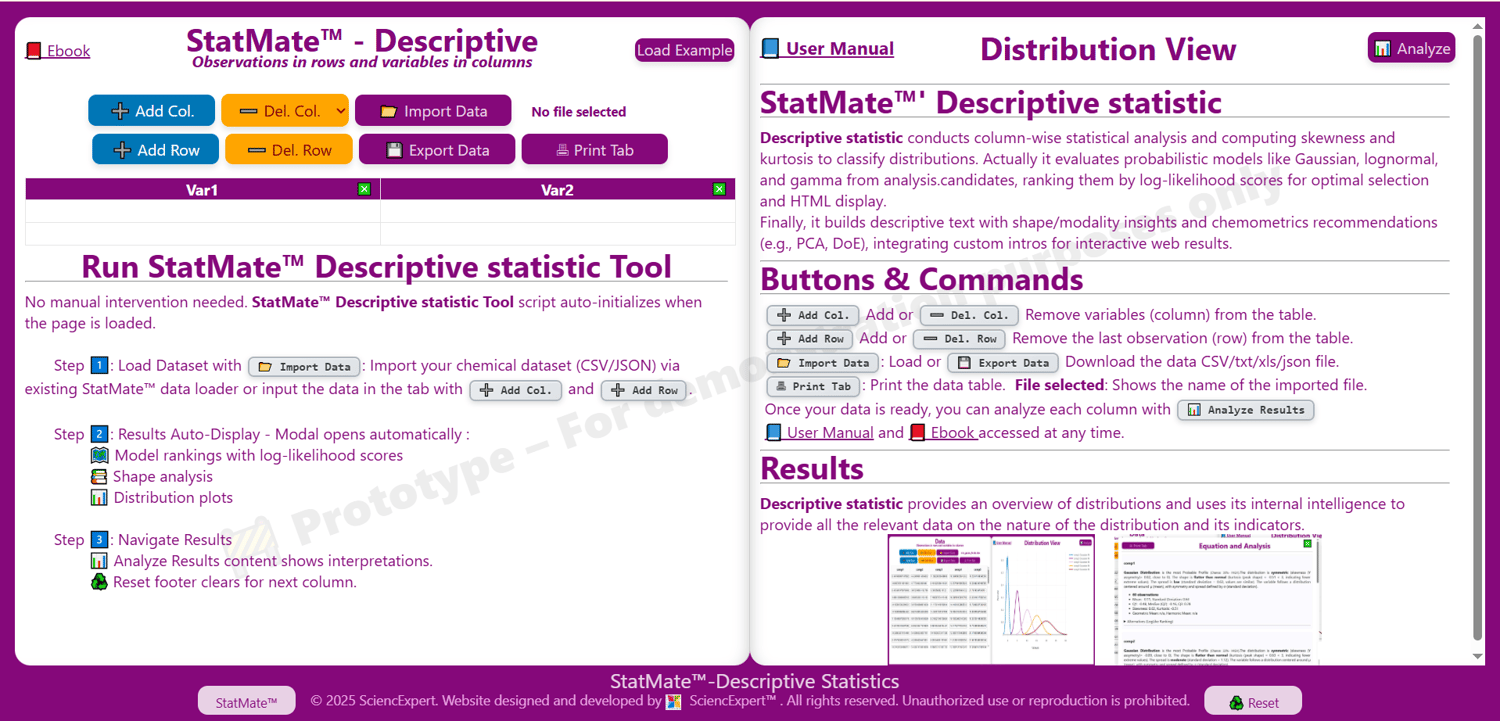
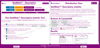
Stat Descriptive StatMate : Unlock Your Data!
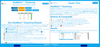
The Descriptive Statistics module in StatMate uses artificial intelligence to help users analyse the nature and distribution of data. The AI interprets statistical indicators and distribution patterns to help select the most appropriate methods.
It helps to identify asymmetries, outliers and hidden structures. This transforms numerical results into actionable recommendations. In practice, it enables reliable decision-making from the outset of experimental or analytical projects.
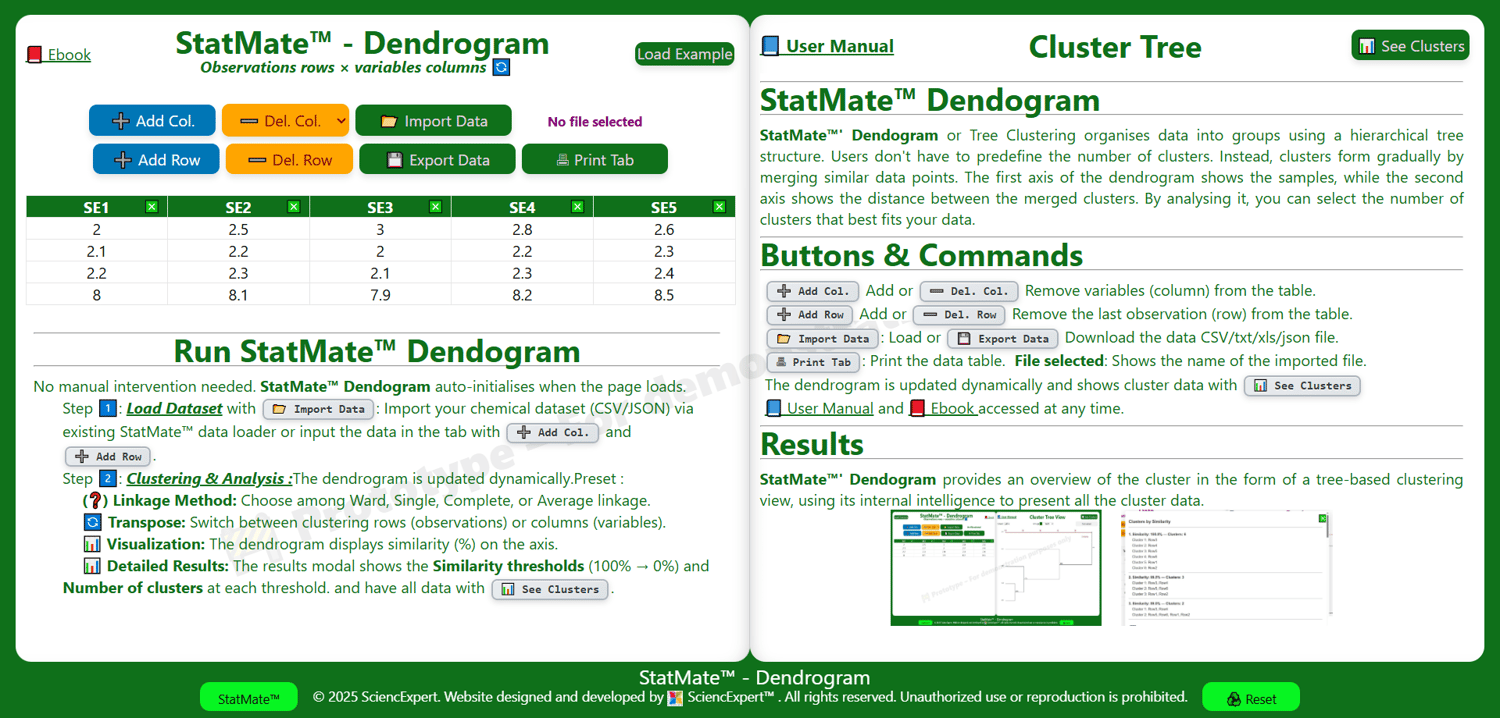
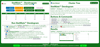
StatMate Dendrogram: Hierarchies Unlocked
The Dendrogram module in StatMate analyses and interprets hierarchical data structures. Its data visualisation tool helps students and researchers select relevant cut-off thresholds and grasp cluster formation, eliminating the need to determine the number of clusters from the outset. The module highlights proximities, dissimilarities and levels of similarity between observations or variables. Complex relationships become visually comprehensible and actionable. In practice, this module facilitates classification, reduces complexity and informs subsequent analysis.
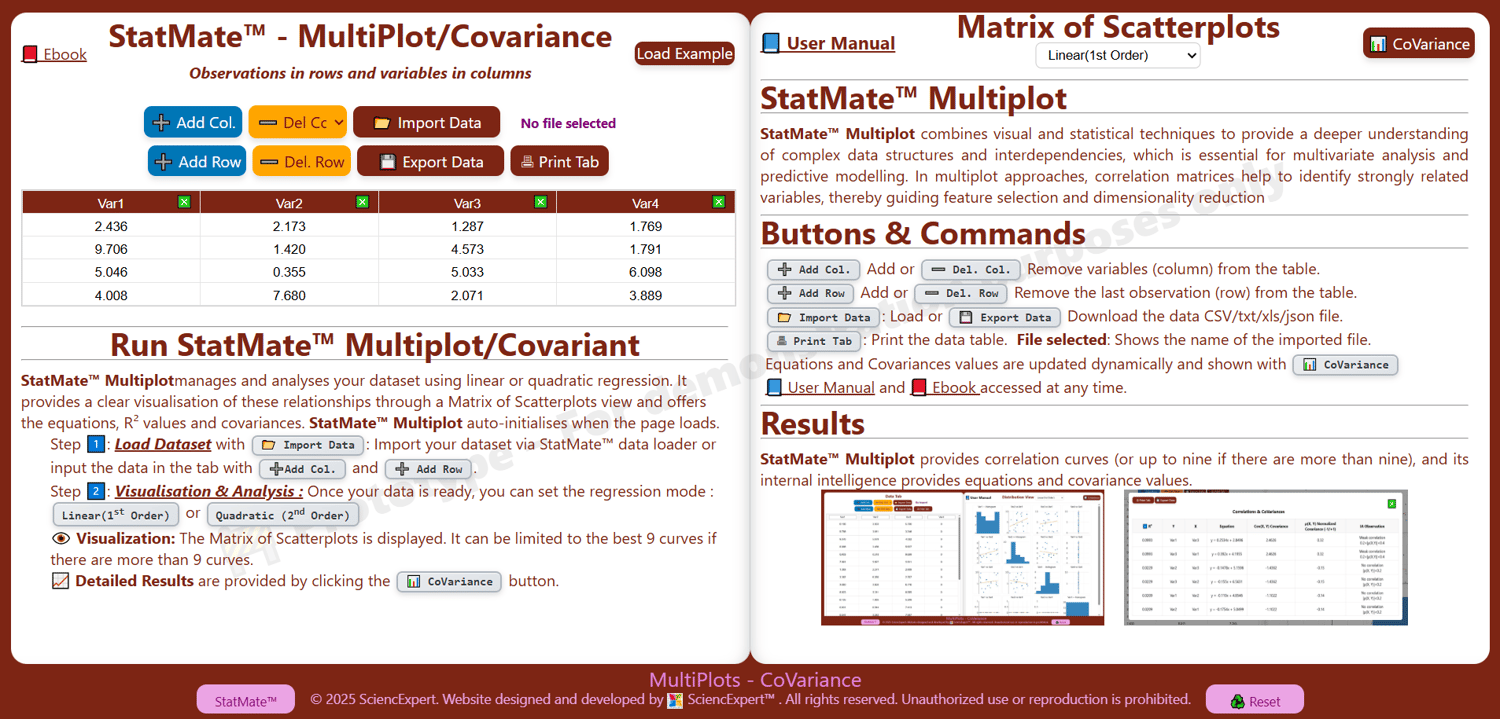
StatMate Multiplot:Covariance at a Glance, No Headaches
The Covariance/Multiplot module in StatMate puts visualisation at the heart of analysing variable relationships.
Grid matrices and interactive equation generation provide an immediate overview of distributions and dependencies.
Integrated AI provides visual commentary on correlation and covariance levels. Significant relationships emerge without the need for complex calculations or abstract interpretation. In practice, this module enables you to understand, compare and prioritise variables at a glance.
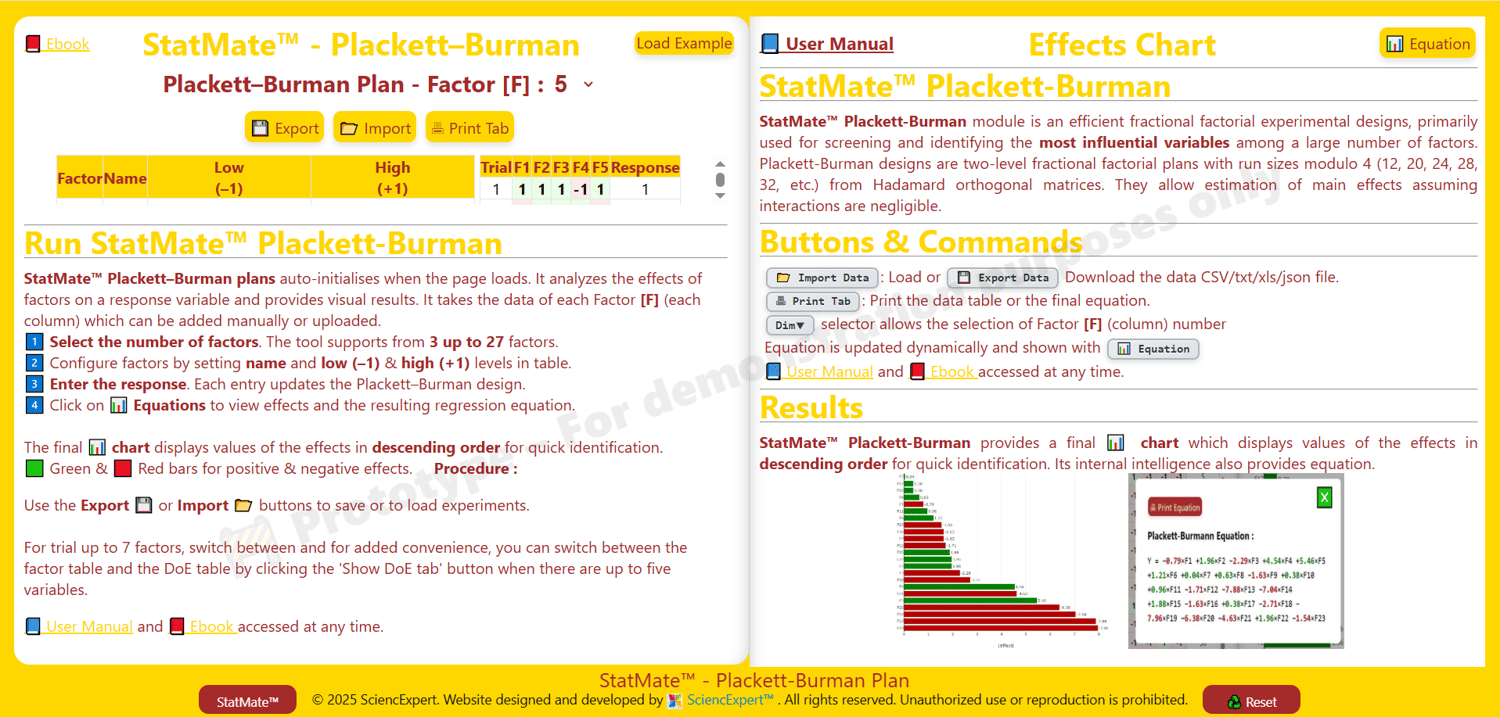
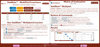
StatMate Plackett-Burman: Key Variables Can’t Hide!
The Plackett-Burman module in StatMate facilitates rapid variable screening by providing clear visualisation of effects.
It graphically represents experimental designs and responses to help you immediately identify influential factors, and its artificial intelligence feature assists with interpreting the relative importance of variables.Non-significant factors can be eliminated quickly, reducing the number of trials required. This module enables the efficient transition from exploratory screening to targeted optimisation.
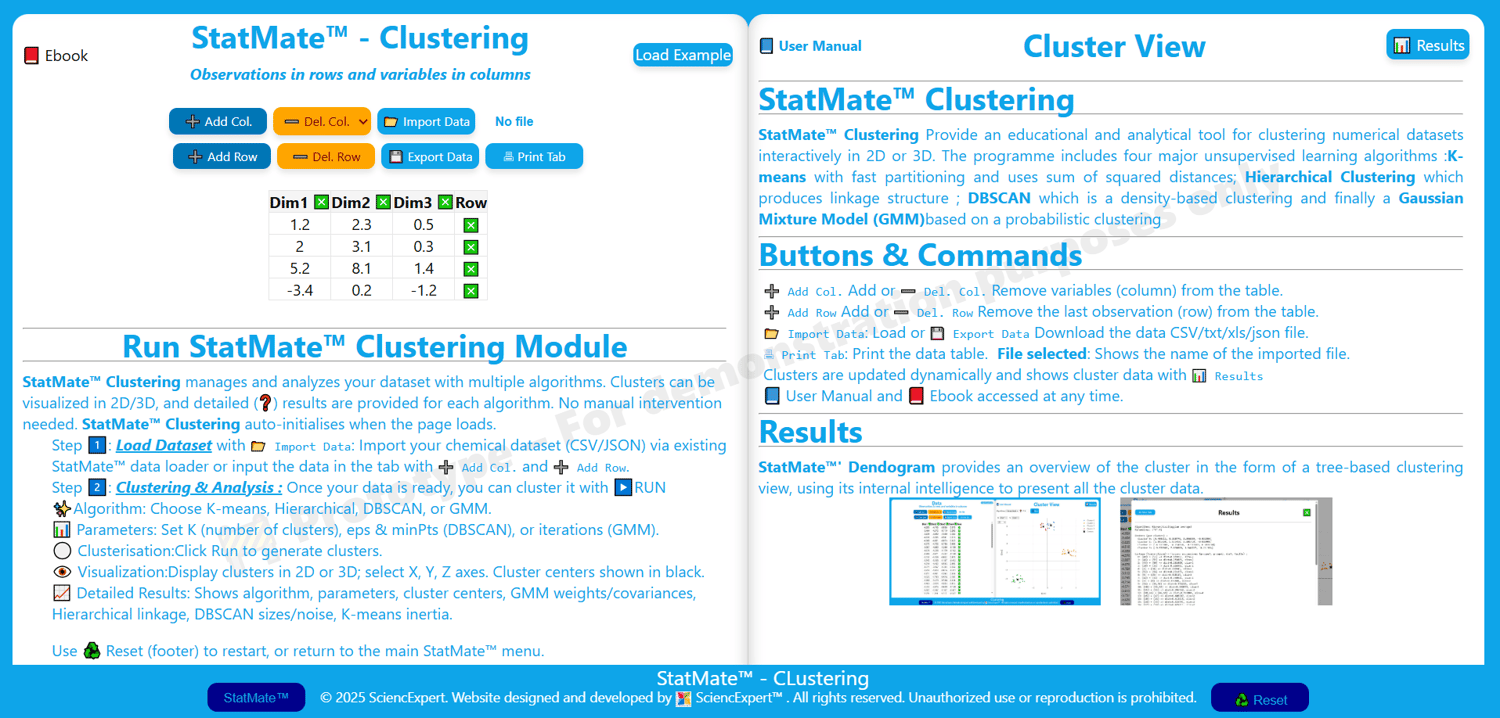
StatMate Clustering: Smarter Clusters, Smarter Decisions
The StatMate Clustering module transforms complex datasets into visually interpretable groups. It uses recognised algorithms (k-means, hierarchical, DBSCAN and Gaussian mixtures) to structure data. The resulting groupings are visualised as clearly defined clusters within the variable space.The equations associated with the centres, boundaries or distributions of the clusters are accessible and interpretable. This dual graphical and analytical approach makes it easier to understand the grouping mechanisms. In practice, it enables clusters to be compared, justified and used in a scientific or educational context.
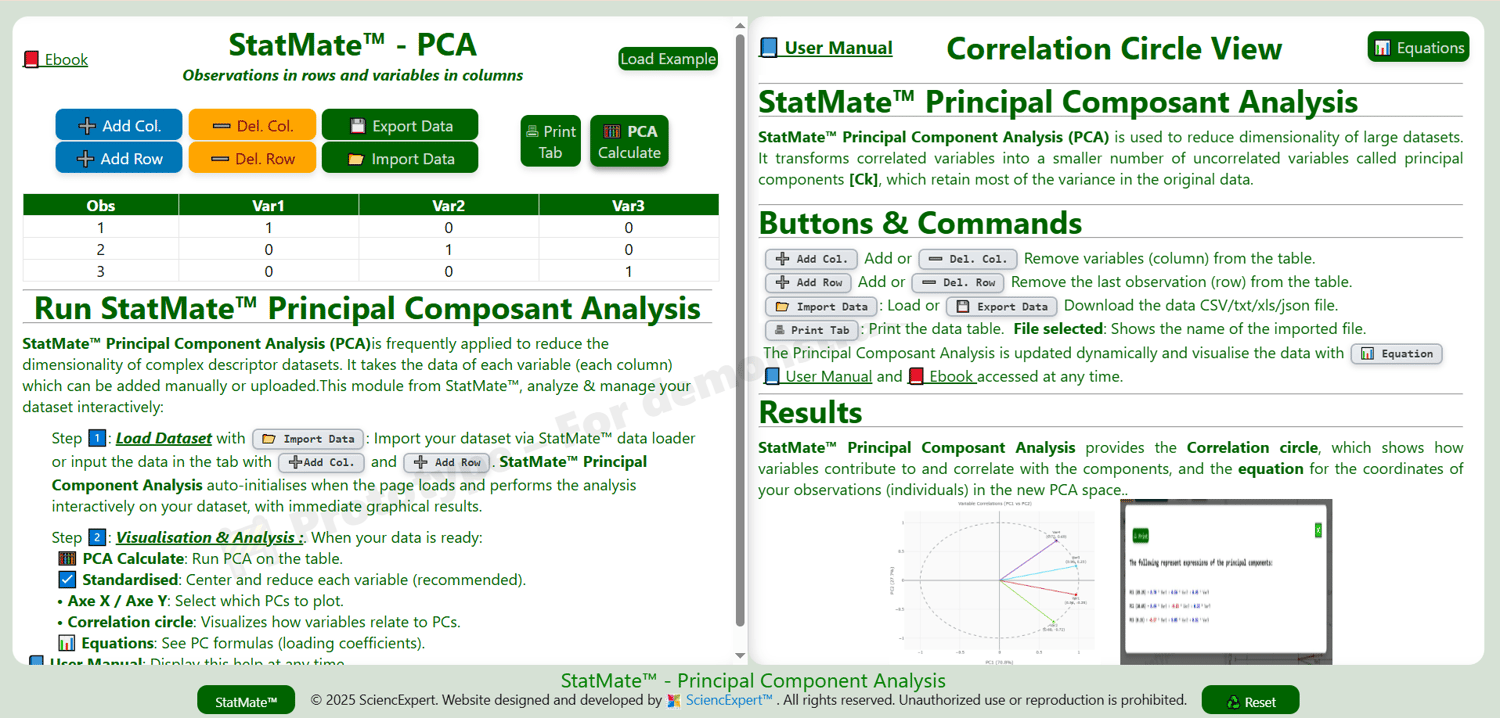
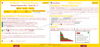
StatMate PCA: Less Complexity, More Clarity
The Principal Component Analysis (PCA) module in StatMate reduces the dimensionality of datasets while preserving essential information. Results can be visualised using interactive graphs, such as screen plots, observation projections and correlation circles. The principal component equations and variable contributions are easily accessible. Complex relationships become legible in a low-dimensional space. In practice, this module enables you to replace numerous correlated variables with a few significant components, thereby simplifying analysis and decision-making.
StatMate Clustering: Smarter Clusters, Smarter Decisions
The StatMate Clustering module transforms complex datasets into visually interpretable groups. It uses recognised algorithms (k-means, hierarchical, DBSCAN and Gaussian mixtures) to structure data.The resulting groupings are visualised as clearly defined clusters within the variable space. The equations associated with the centres, boundaries or distributions of the clusters are accessible and interpretable. This dual graphical and analytical approach makes it easier to understand the grouping mechanisms. In practice, it enables clusters to be compared, justified and used in a scientific or educational context.
StatMate Mixing: Mix It Right
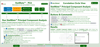
The Mixing Plan module in StatMate is based on recognised mixing models, such as full simplex and fractional designs.
It generates and analyses multi-component compositions within formulation constraints. The results can be visualised using ternary diagrams and interactive response surfaces. StatMate's artificial intelligence automatically identifies optimal areas, as well as the model's maxima and minima. In practice, this module enables rapid formulation optimisation and significantly reduces the number of experimental trials required.

