
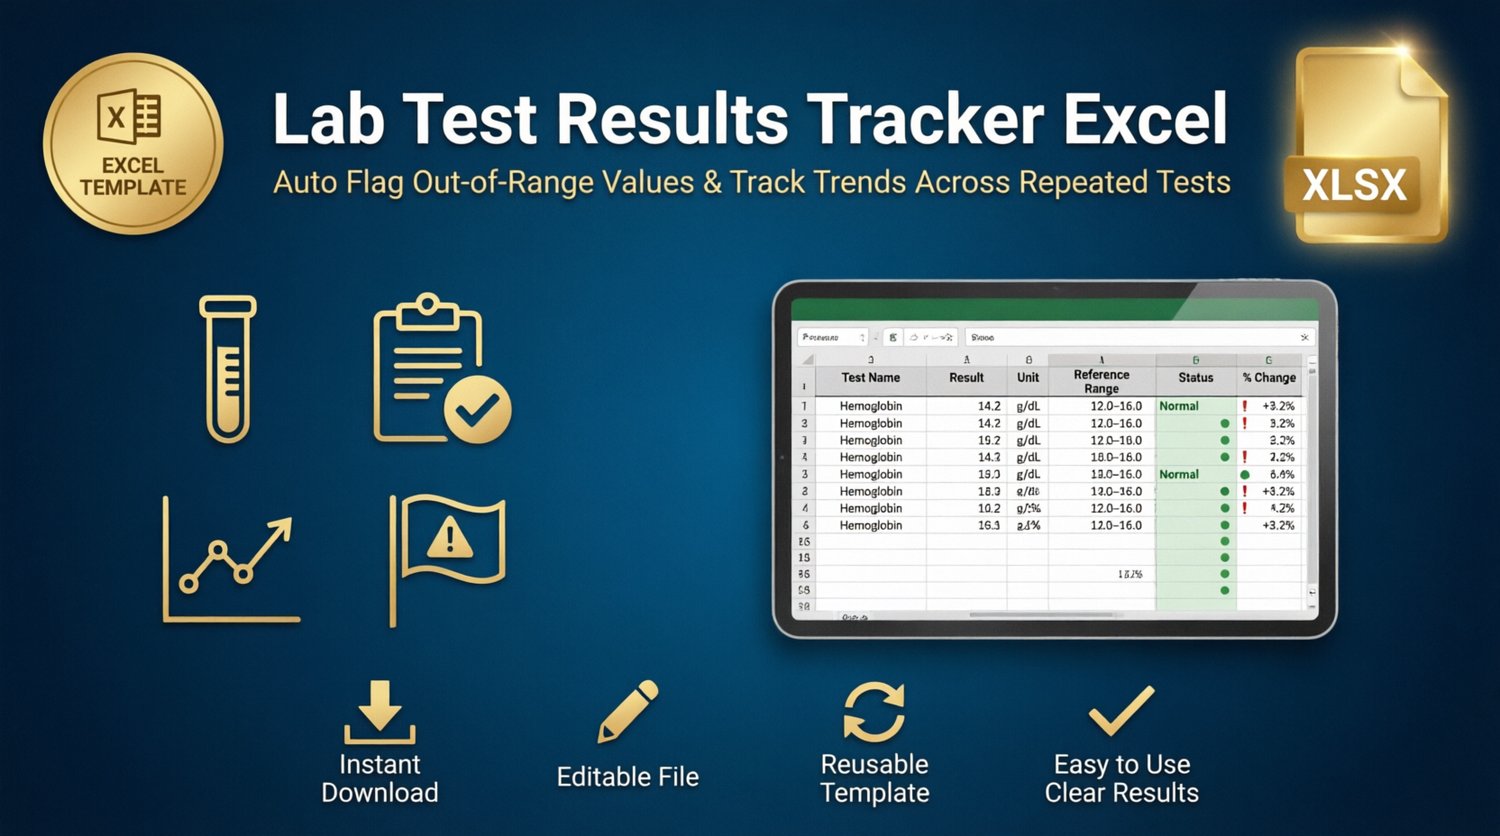
Lab Test Results Tracker Excel — Auto Flag Out-of-Range Values & Track Trends Across Repeated
On Sale
$3.99
$3.99
Most people fall back on a spreadsheet for tracking lab results, but a plain spreadsheet doesn't tell
you what's actually out of range or whether a number is improving or worsening across tests. This one
does both. Enter your result, unit, and the reference range straight from your lab report, and it
automatically flags each result as Low/Normal/High with color coding, calculates the % change versus
your last test of the same type, and includes a built-in trend chart with the reference range plotted
alongside your actual results — so you can see at a glance whether your cholesterol, A1C, vitamin D,
or any repeated panel is heading in the right direction.