
DGL Manufacturing Value Stream Mapping, Process Flow & Production Layout Optimization System — Professional Excel Tool
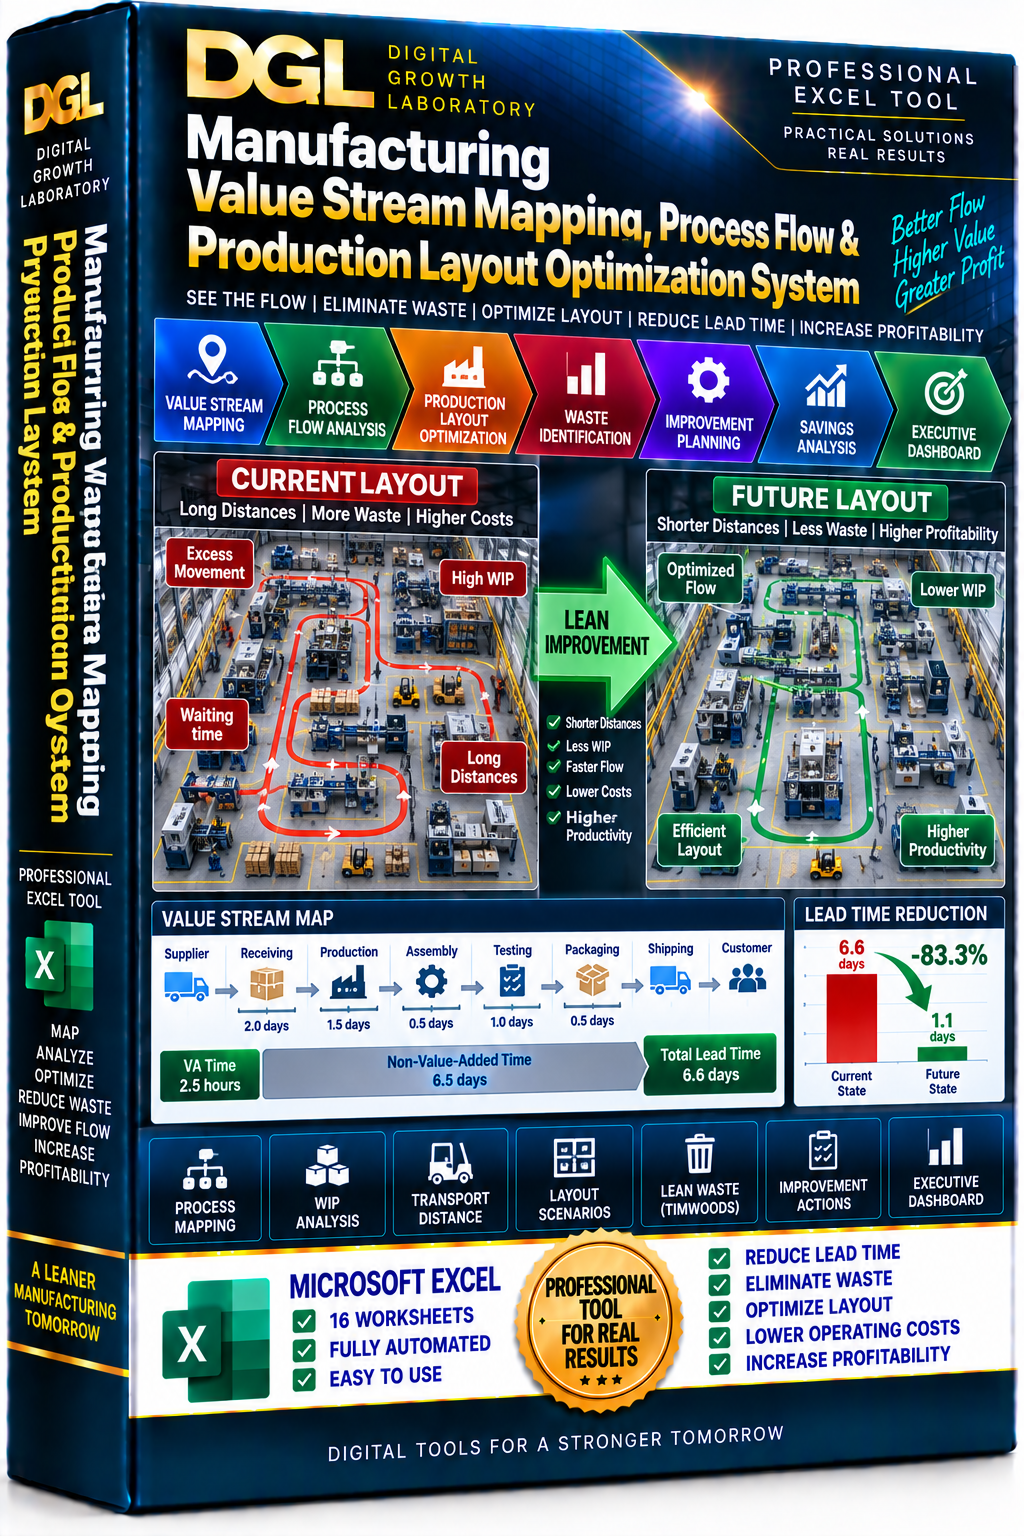
DGL Manufacturing Value Stream Mapping, Process Flow & Production Layout Optimization System is a professional Excel-based Lean Manufacturing management tool designed to analyze, visualize and improve the complete flow of materials, products and production activities through a manufacturing operation.
The system goes beyond a basic Value Stream Map by connecting process flow, cycle time, waiting time, WIP, transportation distance, production layout, Lean waste, future-state planning, improvement actions and financial savings within one structured management system.
The workbook includes 16 professionally structured and connected worksheets:
• START HERE
• Assumptions
• Value Stream Register
• Process Map
• Current State VSM
• VA NVA Analysis
• Material Flow
• WIP & Queue
• Layout Analysis
• Waste Register
• Future State VSM
• Layout Scenarios
• Improvement Actions
• Savings Analysis
• Dashboard
• Instructions
KEY CAPABILITIES
✓ Current-State Value Stream Mapping
✓ Future-State Value Stream Mapping
✓ End-to-end manufacturing process mapping
✓ Process sequence analysis
✓ Takt Time calculations
✓ Cycle Time analysis
✓ Waiting and queue-time analysis
✓ Value-Added vs Non-Value-Added analysis
✓ VA Ratio calculations
✓ Production lead-time analysis
✓ Work-in-Process (WIP) analysis
✓ WIP days and carrying-cost analysis
✓ Material-flow analysis
✓ Transportation-distance analysis
✓ Annual material-handling calculations
✓ Production-layout analysis
✓ Process adjacency analysis
✓ Excessive movement identification
✓ TIMWOODS Lean waste identification
✓ Bottleneck and flow-loss identification
✓ Current vs Future State comparison
✓ Production-layout scenario planning
✓ Travel-distance reduction calculations
✓ Lead-time reduction calculations
✓ WIP reduction calculations
✓ Improvement action management
✓ Expected annual savings calculations
✓ Executive Value Stream & Layout Dashboard
The system helps management answer critical questions:
Where is production lead time being lost?
How much of total lead time is actually value-added?
Where is excessive WIP accumulating?
Which processes create the largest queues and waiting times?
How far does material travel through the factory?
Which production areas should be located closer together?
Where is unnecessary transportation and motion occurring?
Which Lean wastes have the greatest operational impact?
How would a redesigned production layout improve flow?
How much could lead time, WIP and transportation be reduced?
What financial benefit could the improvement projects generate?
Which improvement actions should management prioritize first?
The Current-State VSM provides a structured view of the existing manufacturing flow, including cycle time, waiting, WIP, uptime, quality performance and transportation.
The Future-State VSM allows management and Lean teams to design an improved production flow with reduced waiting, lower WIP, shorter travel distances and better process synchronization.
The Layout Scenario Planner allows alternative production layouts to be compared using travel distance, handling hours, annual costs, expected savings, payback and implementation risk.
The Executive Dashboard provides a centralized management view of current and future lead time, WIP reduction, travel-distance reduction, Lean waste and expected financial savings.
Ideal for:
• Manufacturing companies
• Lean Manufacturing teams
• Continuous Improvement teams
• Industrial engineers
• Process engineers
• Production managers
• Plant managers
• Operations managers
• Manufacturing engineers
• Six Sigma professionals
• Factory layout planners
• Operational Excellence teams
• Executive management
This is not a simple Value Stream Mapping diagram. It is a structured manufacturing flow and layout optimization system designed to connect Lean analysis with measurable operational and financial improvement.
Practical Tools. Real Results.
Digital Growth Laboratory
Business Tools for a Stronger Tomorrow.