


RSI Dashboard Pro©
On Sale
$53.00
(8% off)
$48.76
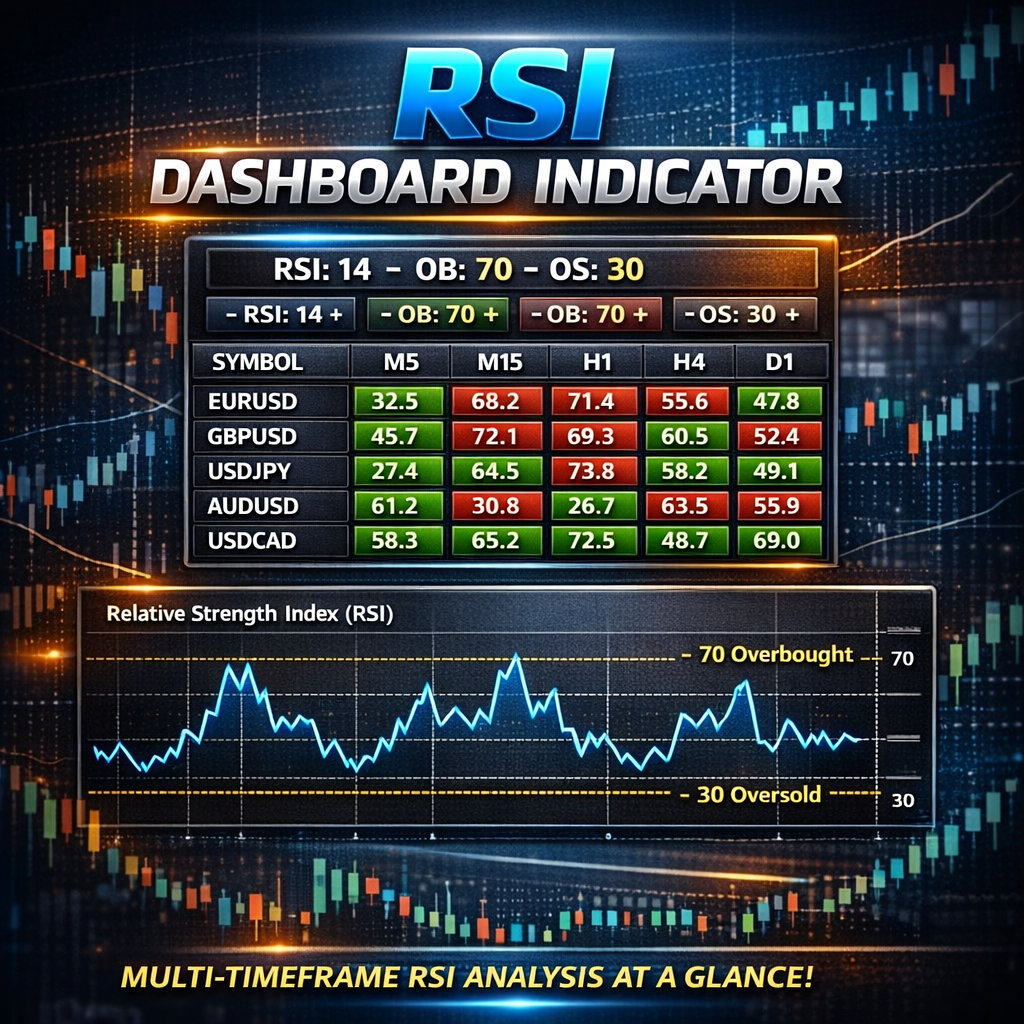
RSI Dashboard PRO — an advanced and elegant panel that displays the Relative Strength Index (RSI) values for multiple symbols and multiple timeframes in one compact dashboard.
With one click, you can switch charts or timeframes directly from the panel — making RSI analysis faster, easier, and more visual.
Key Features
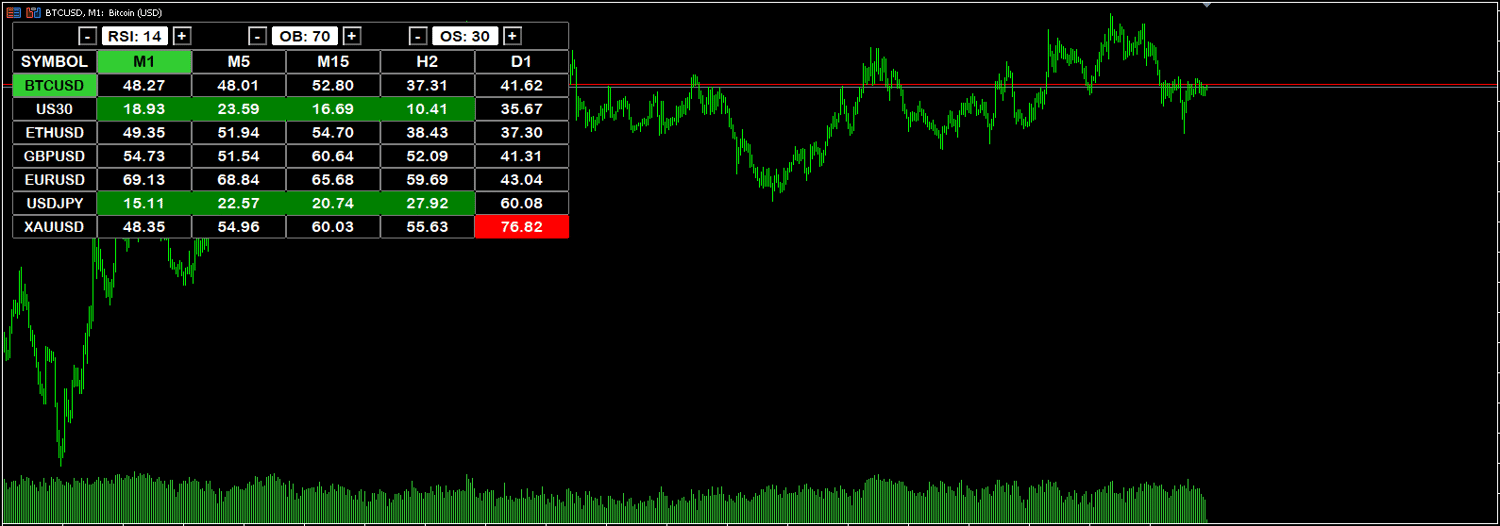
- Displays RSI values for all market watch symbols and selected timeframes.
- Auto-coloring:
- Oversold zones (RSI < OS) highlighted in GREEN
- Overbought zones (RSI > OB) highlighted in RED
- Neutral RSI values in WHITE/GRAY
- Switch chart symbol instantly by clicking a pair name.
- Change timeframe with one click on the timeframe buttons.
- Automatically detects all active symbols in Market Watch.
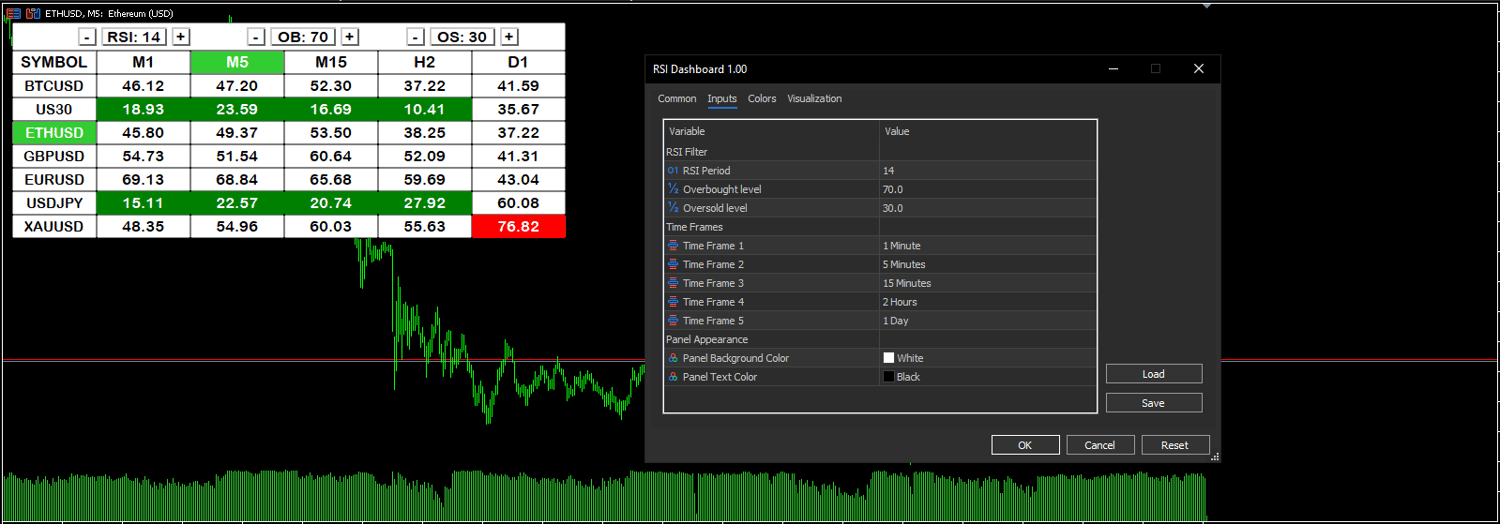
- Customizable colors, RSI period, and threshold levels.
- Clean, fast, and professional interface.
- Works with all instruments (Forex, indices, metals, crypto, etc.).
Inputs
RSI_Period ⟶ Period of the RSI indicator
RSI_Overbought ⟶ Overbought level (default 70)
RSI_Oversold ⟶ Oversold level (default 30)
Time Frame 1 – Time Frame 5 ⟶ Custom timeframes to display
Panel Background Color ⟶ Background color of the dashboard
Panel Text Color ⟶Text color of the dashboard
How It Works
- Attach the indicator to any chart.
- The dashboard will automatically show RSI values for all symbols and selected timeframes.
- Click on:
- Symbol name → to switch the chart to that pair.
- Timeframe label → to switch the chart timeframe instantly.
- The RSI values update automatically in real-time.
Example Use Case
Perfect for traders who use multi-timeframe RSI confirmation — for example:
- Trade only when RSI aligns on several timeframes.
- Spot overbought/oversold conditions across all markets instantly.
💰 One-Time Payment
🔁 Lifetime License
🚫 No Monthly Fees
🔄 Free Updates Included
You Might Also Like

On Sale
Smart EA Summary MT5©
$45.08
$49.00
$45.08
On Sale


On Sale
GOLDEN Guard Pro EA©
From $62.00
$999.99
On Sale

On Sale
FOREX Strike EA©
From $59.80
$999.99
On Sale

On Sale
Smart Risk Manager©
$32.20
$35.00
$32.20
On Sale
On Sale
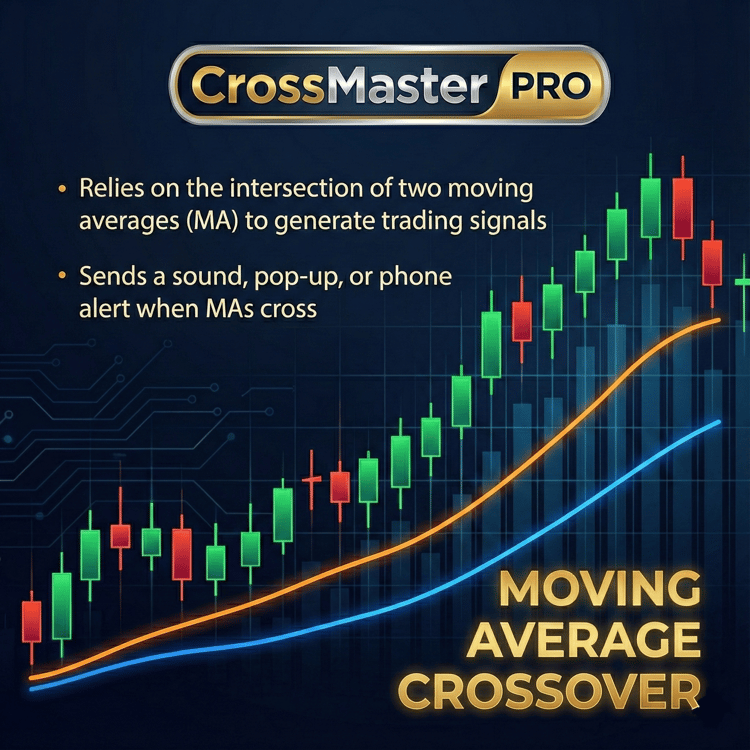
CrossMaster PRO©
$49.68
$54.00
$49.68
On Sale

On Sale
BitRocket EA MT5©
From $59.80
$999.99
On Sale


On Sale
Gold Strike EA©
From $100.00
$999.99
On Sale