

Technological-Scrap-The-Hidden-Cost-of-Innovation-and-How-to-Reduce-It - Level 2
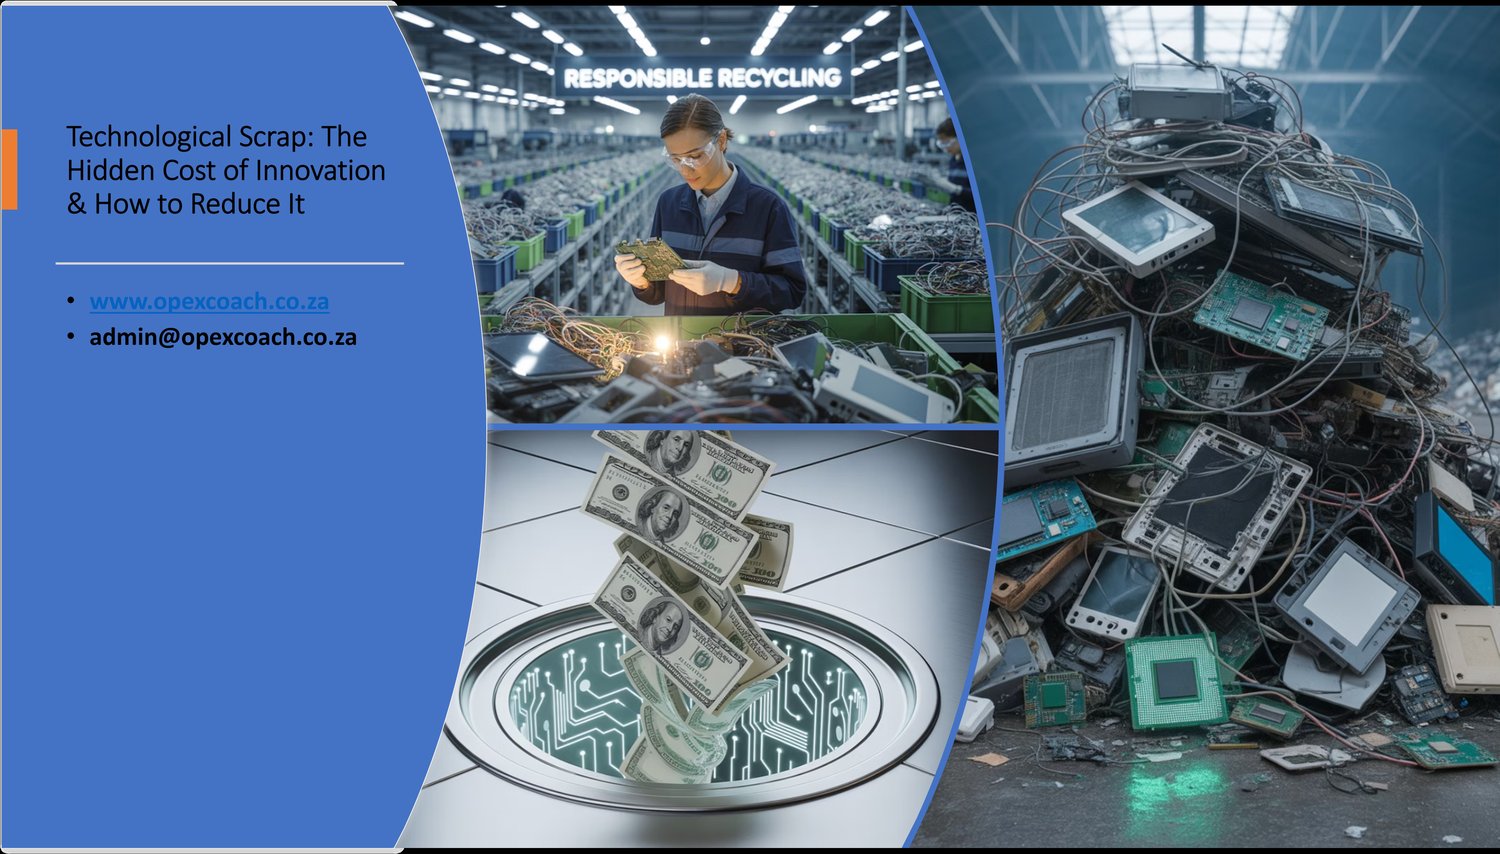
Technological Scrap: The Hidden Cost of Innovation & How to Reduce It
Level 2 Summary
Innovation drives growth—but it also generates a massive hidden cost: technological scrap. From wasted materials and redundant software to failed projects and e-waste, scrap silently drains 4–7% of production budgets, costing the tech sector $127–221B annually while undermining sustainability.
🔎 What is Technological Scrap?
- Physical Scrap – defective PCBs, obsolete smartphone parts, packaging waste.
- Digital Scrap – unused SaaS licenses, zombie servers, redundant data storage.
- Process Scrap – failed IT projects, excessive iterations, siloed R&D duplication.
Across the innovation lifecycle, 72% of prototypes never reach production, semiconductor yields lose 12–18%, and only 9% of recoverable materials are reclaimed.
💰 The True Cost
- Materials: $44.5B lost annually in components and precious metals.
- Labor: $31.8B wasted on rework, duplicate R&D, and abandoned designs.
- Disposal & Downtime: $34B+ in e-waste handling and production stoppages.
- Customer & Compliance: $16.6B in returns, recalls, and regulatory penalties.
For mid-sized firms ($100–250M revenue), eliminating scrap inefficiencies could unlock $4–17.5M yearly—enough to fund multiple new product launches.
⚠️ Hidden Impacts Beyond Cost
- Reputation – quality failures erode trust, reducing cross-product sales by up to 31%.
- Environment – $57B in precious metals lost yearly, with only 17.4% of e-waste recycled.
- Market Opportunity – delays average 4.7 months, costing $218K per day in lost revenue.
- Innovation Capacity – engineers at high-scrap firms spend 26% less time on innovation.
🚀 Solutions from Industry Leaders
Top performers cut scrap by 40–60% below average using:
- Closed-loop systems & circular design
- MES & real-time monitoring for predictive prevention
- AI-driven inspection & predictive maintenance reducing defect scrap by up to 48%
- Cross-functional training & poka-yoke preventing operator-driven errors
- Blockchain traceability & IoT monitoring reducing inventory waste by 43%
📊 The Scrap Reduction Playbook
- Assess Your Scrap Profile – value stream mapping + asset audits.
- Measure & Benchmark – track scrap rate, FPY, component utilization.
- Prevent & Control – predictive analytics, preventive maintenance, standardized SOPs.
- Optimize Human & Digital Factors – continuous upskilling, better changeovers, micro-learning.
✅ Bottom Line
Companies that systematically address technological scrap achieve:
- 3.2% higher profit margins
- 27% improved resource utilization
- 17–23% higher output while spending less on quality control
👉 In a world where 76% of consumers and 82% of investors prioritize sustainability, reducing technological scrap isn’t just cost-saving—it’s a competitive advantage.