

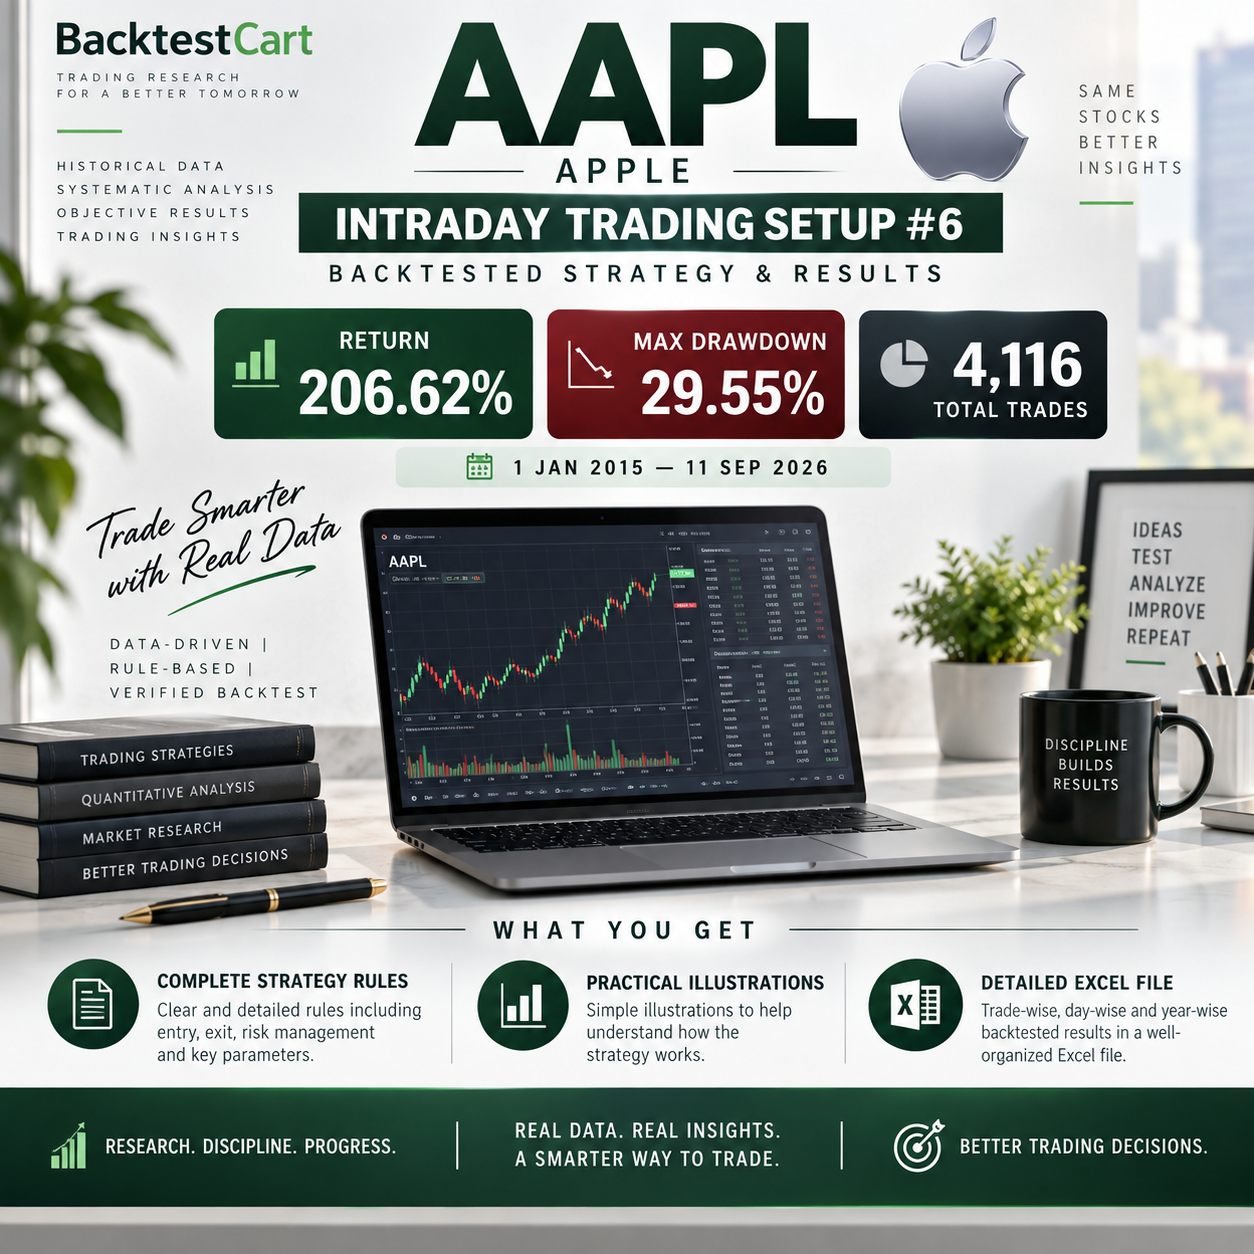
AAPL Intraday Setup #6 — 4,116 Trades | 206.62% Return | Full Strategy + Excel
AAPL Intraday Setup #6 — Backtested Strategy + Excel Data
A comprehensive historical backtest of an intraday trading setup for AAPL (Apple), covering the period 1 January 2015 to 11 September 2026.
The backtest contains 4,116 trades and was tested using a standard $100,000 position size per trade, with no compounding. Based on the supplied results, the strategy generated a 206.62% historical return with a 29.55% maximum drawdown.
Backtest Highlights
- 4,116 Total Trades
- 206.62% Historical Return
- 29.55% Maximum Drawdown
- Position Size: $100,000 per trade
- Compounding: None
- Backtest Period: 1 January 2015 – 11 September 2026
What You Get
✓ COMPLETE STRATEGY RULES
Detailed Long, Short, entry, stop-loss, target and trade-management rules, including key parameters.
✓ PRACTICAL ILLUSTRATIONS
Simple and easy-to-understand illustrations explaining how the setup works.
✓ DETAILED EXCEL FILE
Complete trade-wise, day-wise and year-wise backtested results in a well-organized Excel file for independent analysis.
Important Note
These are historical backtest results based on the stated methodology and assumptions. Past backtested performance does not guarantee future results.
Study the Strategy. Analyze the Data. Make Your Own Assessment.