
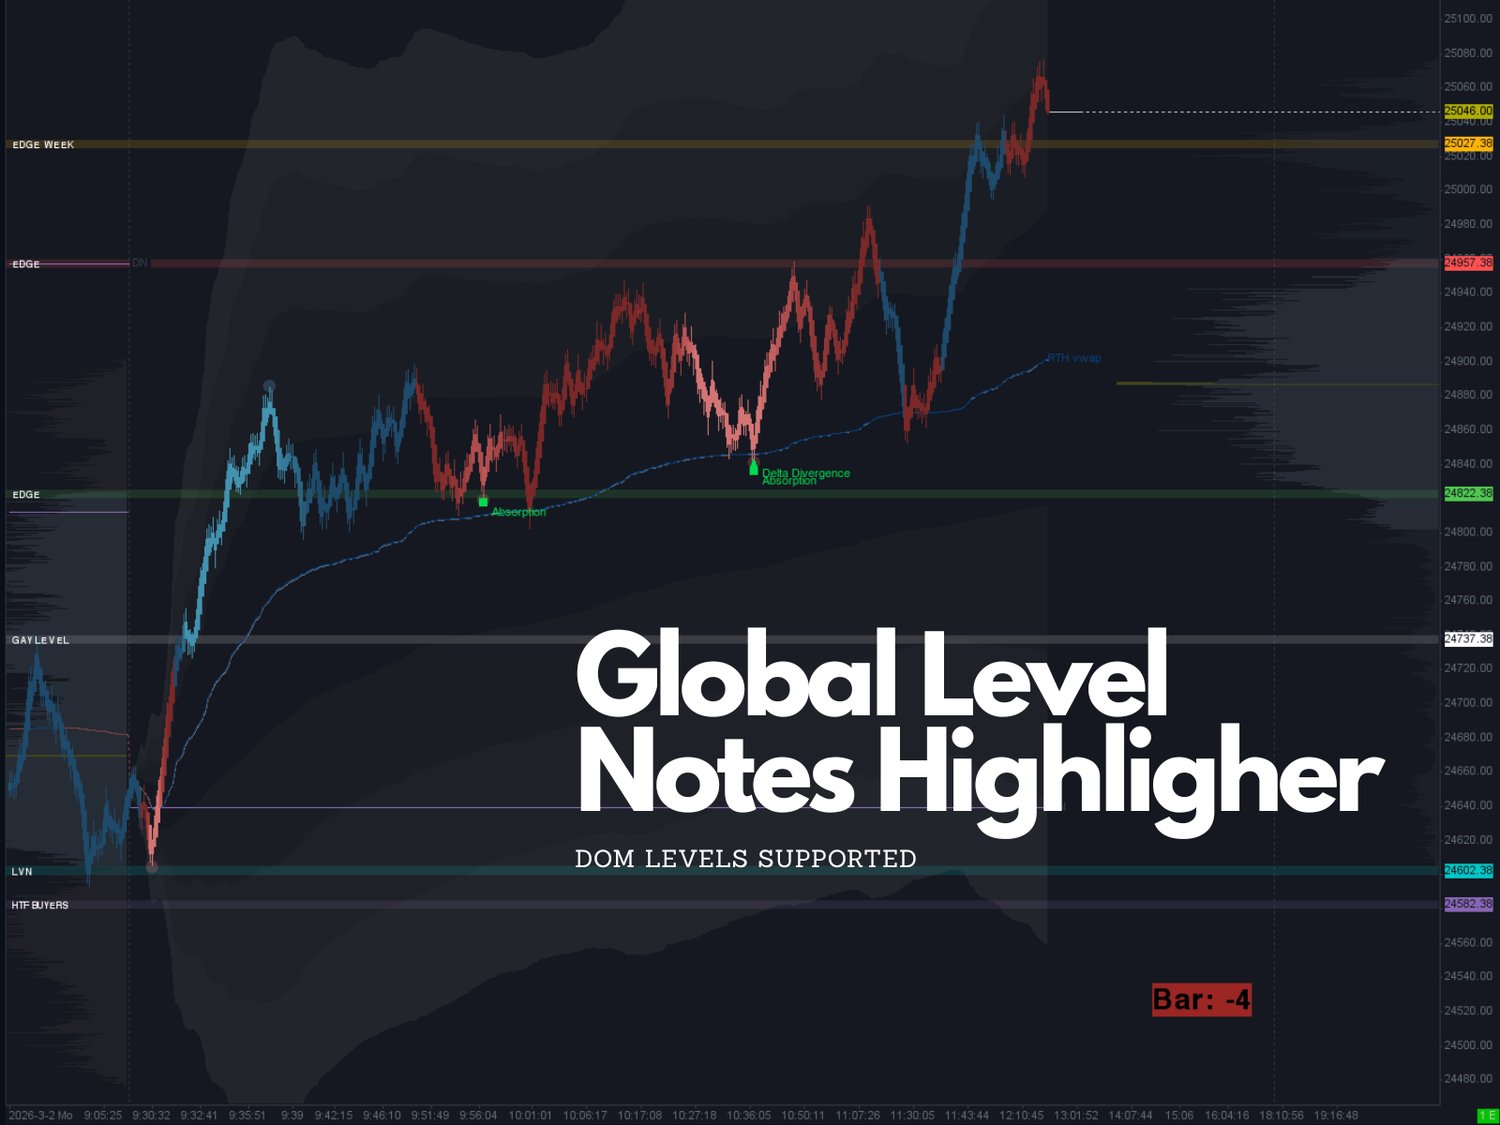
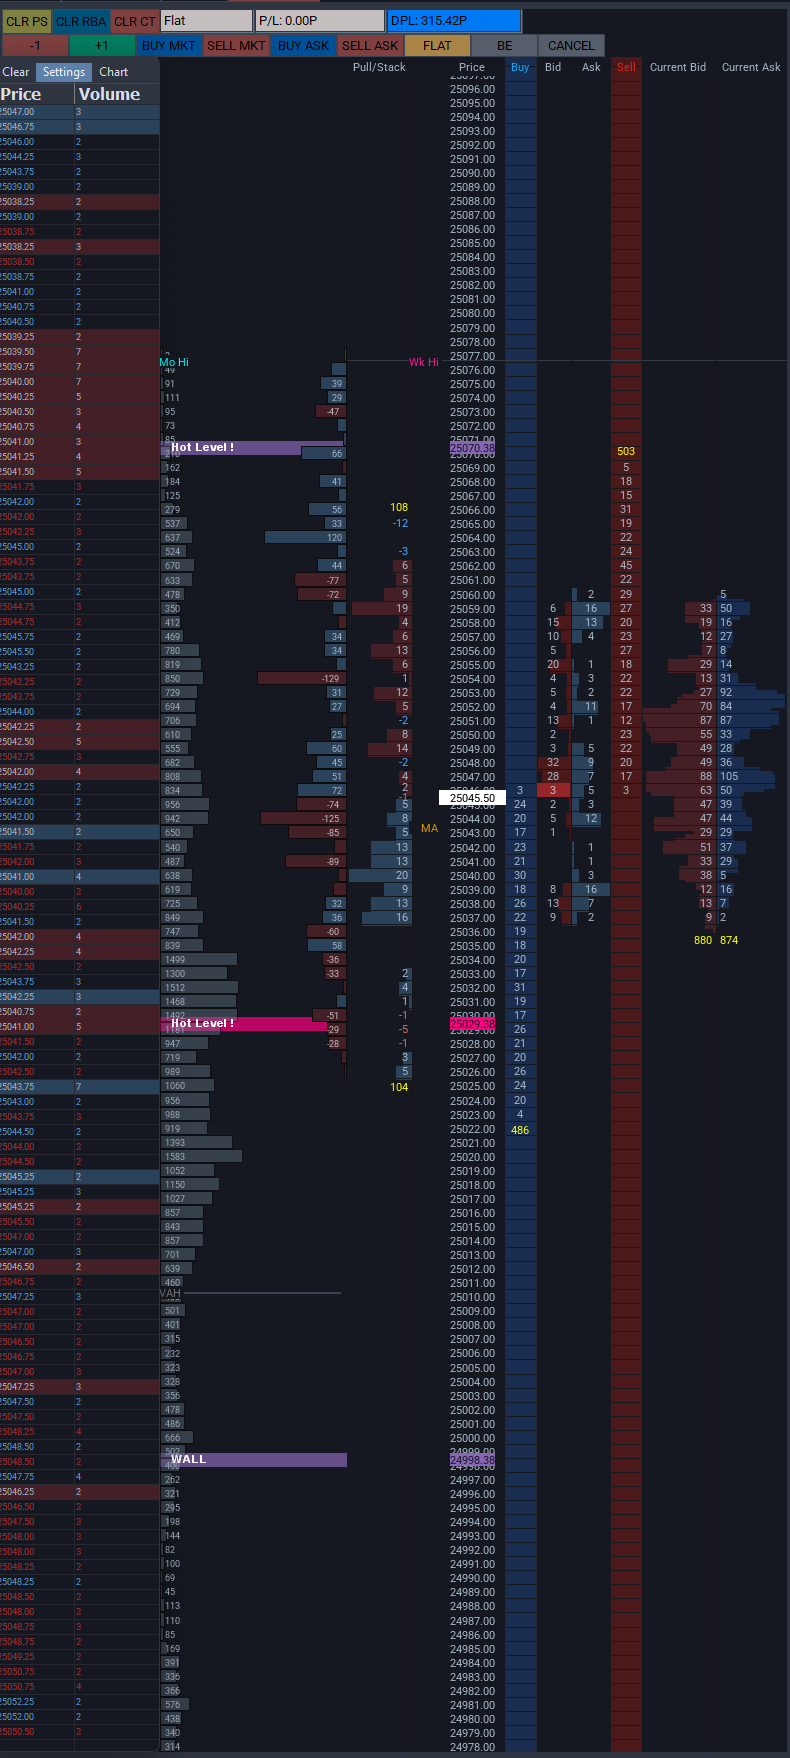
Click DOM Highlighter & Notes
I wanted to share a custom study I put together for Sierra Chart. I originally built this because I was getting frustrated with how clunky the default drawing tools are when you're trying to mark up the DOM in real-time.
If you trade order flow, you know the pain: you spot a massive limit order, a trap, or a key level on the DOM or your chart, but by the time you grab a drawing tool, place it, and type out a text note, the market has already moved. Plus, keeping those lines synced across all your different charts is always a headache.
I built this to make the whole process instant. You just drop the study on your DOM and your other charts, and you can manage your execution levels using just your mouse and keyboard modifiers. No menus, no drawing tools, no lag.
How to use it:
Shift + Click (on any price): Instantly add a highlight block. Click it again to delete it.
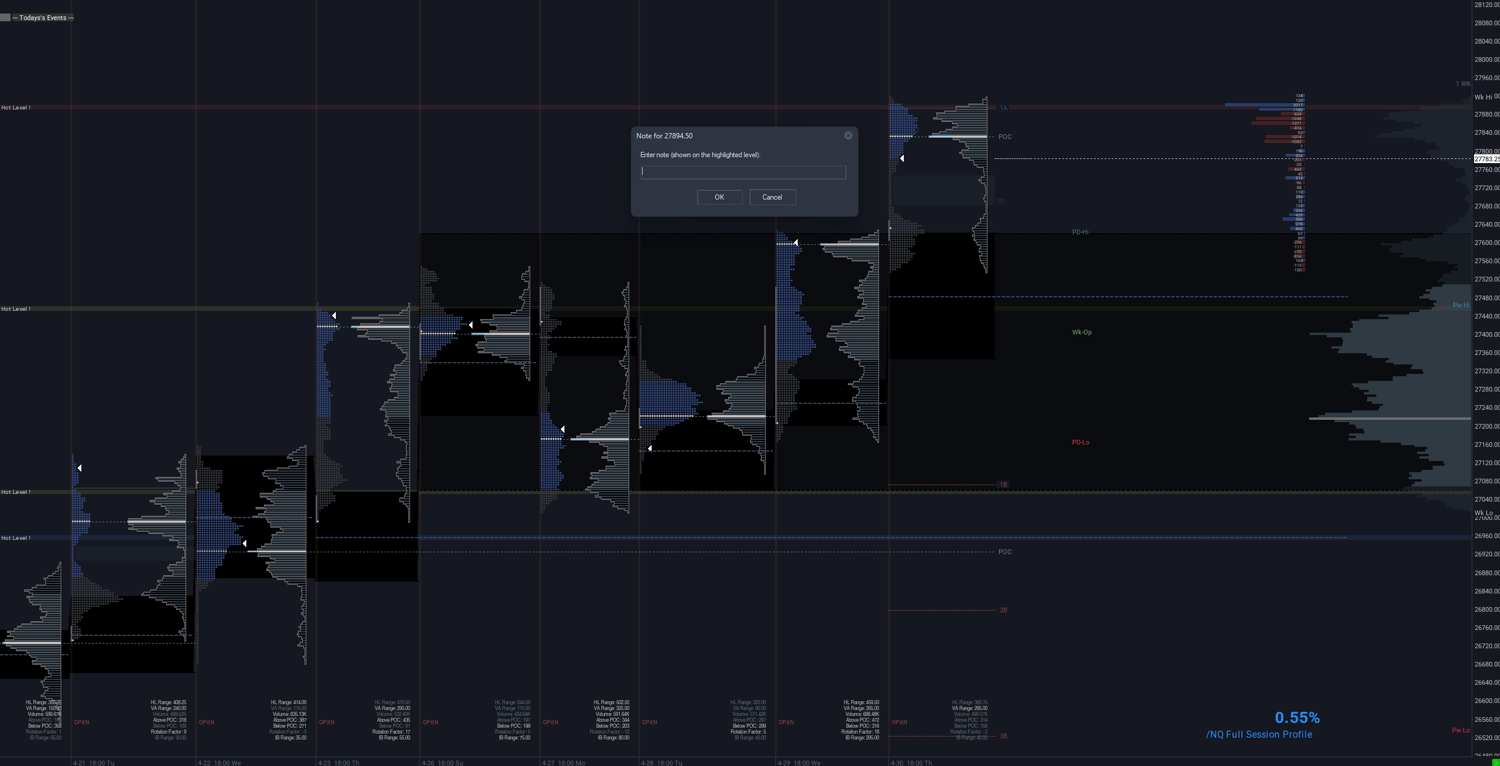
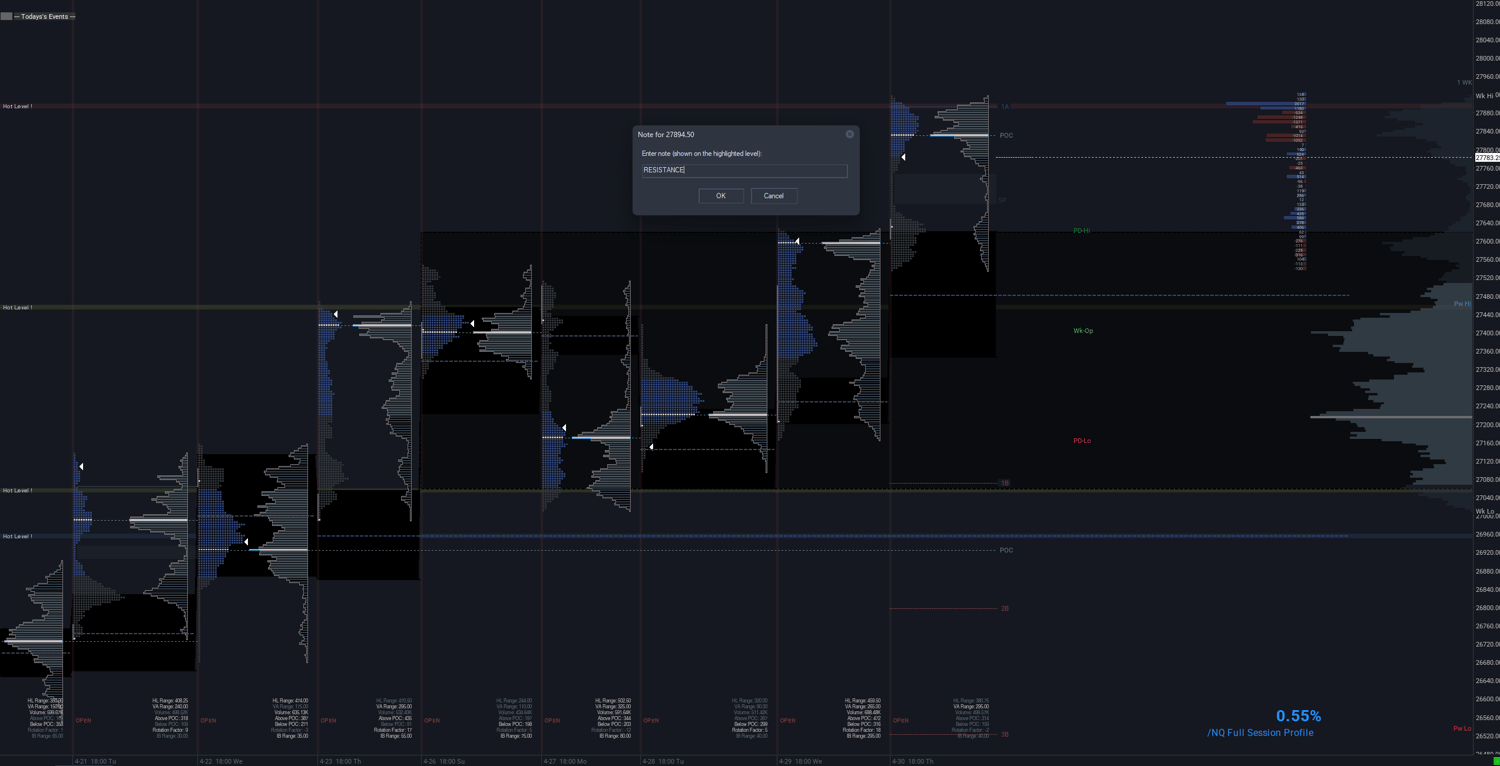
Ctrl + Click (on any price): Instantly drops a level and pops up a quick text box. Type a note (like "Iceberg", "HOD", or "News"), hit Enter, and it places the text perfectly on top of the highlight.
Shift + Alt + Click (on a level): Opens a color picker so you can dynamically color-code specific zones on the fly.
Alt + Click (anywhere): Instantly delete ALL levels globally.
Shift + Ctrl + Click (anywhere): Temporarily hide all levels on just that specific chart to clear up screen clutter. It leaves a bright red "●" on your screen so you know they are hidden. Click it again to bring them back.
What makes this version truly powerful (Under the Hood):
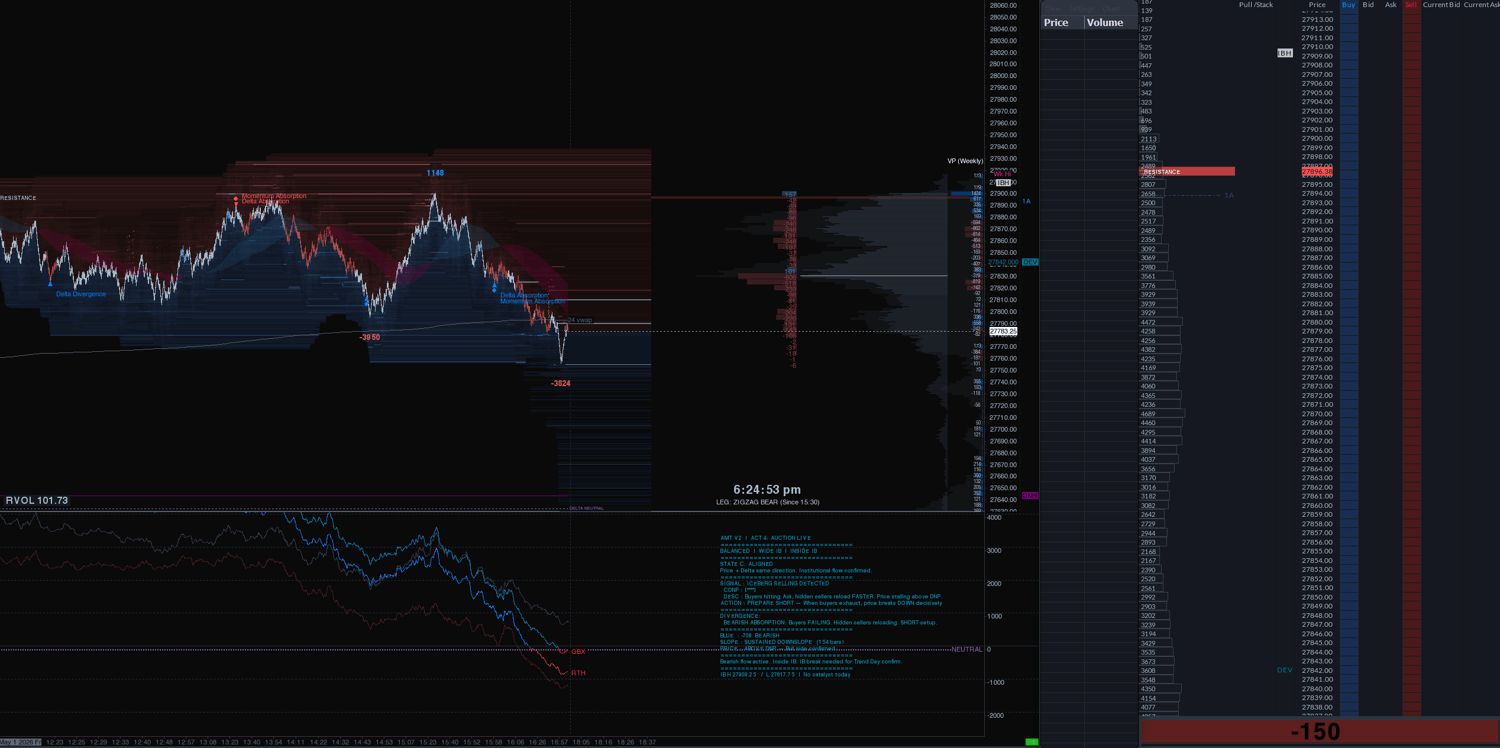
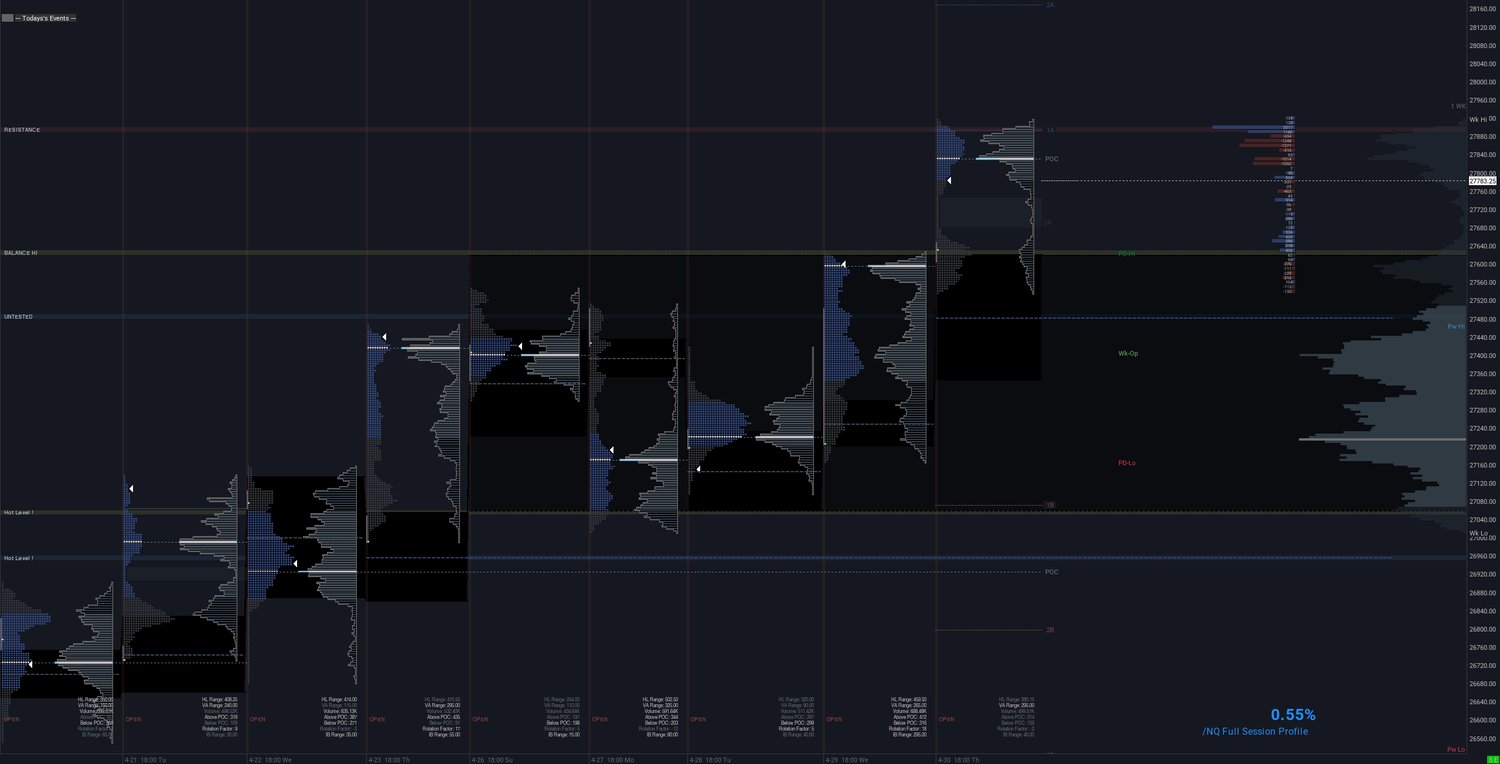
Cross-Chartbook Global Sync: This isn't just basic syncing. If you add this study to your DOM, your Footprint, and your 5-minute chart, everything syncs automatically—even across completely different Chartbooks. Mark a level on your DOM, and it instantly paints everywhere else sharing that ticker (like NQ).
Smart Alerts: Turn on audio/text alerts in the settings. It’s coded to only trigger on the entry transition (the first time price enters your highlighted zone). It won't spam your ears on every single tick while price chops around inside it.
Handles Tick Compression: If you trade NQ and compress your DOM (like me, say 4 ticks per row), the study calculates the exact visual block size and highlights the entire zone flawlessly.
Saves on Restart: You won't lose your levels if you close Sierra Chart. Everything saves to your local disk and reloads exactly how you left it.
Setup:
You can change the default colors, transparency, tick tolerances, and font sizes in the standard study settings.
Give it a try and let me know if you run into any bugs or have ideas for tweaks. Hope it helps clean up your execution workflow!
⚠️ Disclaimer: Trading futures carries inherent risk; trade at your own discretion. All sales are final.
LIFETIME ACCESS HERE
SYNC WITH OTHER CHARTS AND WITH DIFFERENT CHARTBOOKS