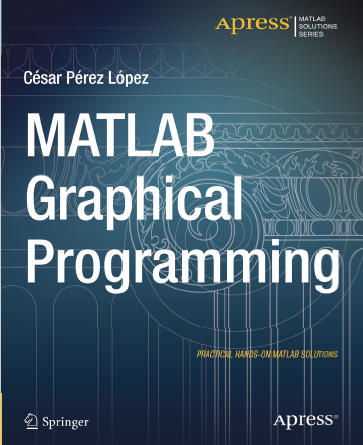
MATLAB_Graphical_Programming
On Sale
$1.99
$1.99
MATLAB enables you to work with its graphics capabilities in almost all areas of the experimental sciences and engineering. The commands that MATLAB implements in job related graphics are quite useful and are very efficient.
MATLAB has functions for working with two-dimensional and three-dimensional graphics, statistical graphs, curves and surfaces in explicit, implicit, parametric and polar coordinates. It also works perfectly with twisted curves, surfaces, volumes and graphical interpolation.
What you’ll learn?
You will learn to:
Program MATLAB to take advantage of its graphics functionality
Create two and three dimensional graphics in MATLAB
Create volumetric and other specialized graphics
Who this book is for:
This book is for those who deal in graphics at many levels wanting to graph and analyze the functions/problems graphically.
Table of Contents:
1. Introducing MATLAB for Graphical Programming
2. Two-Dimensional Graphics with MATLAB
3. Three-Dimensional Graphics with MATLAB
4. Displaying Volumes and Specialized Graphics with MATLAB
5. MATLAB Special Graphics Commands
6. Polynomials and Graphics Interpolation with MATLAB
7. Appendix A: Graphics Programming with MATLAB - Variables, Numbers, Operators and Functions

