
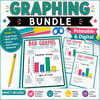

Graphing Worksheets: Bar Graphs Picture Graphs Line Plots Math Anchor Charts
📊 Data & Graphing Activities
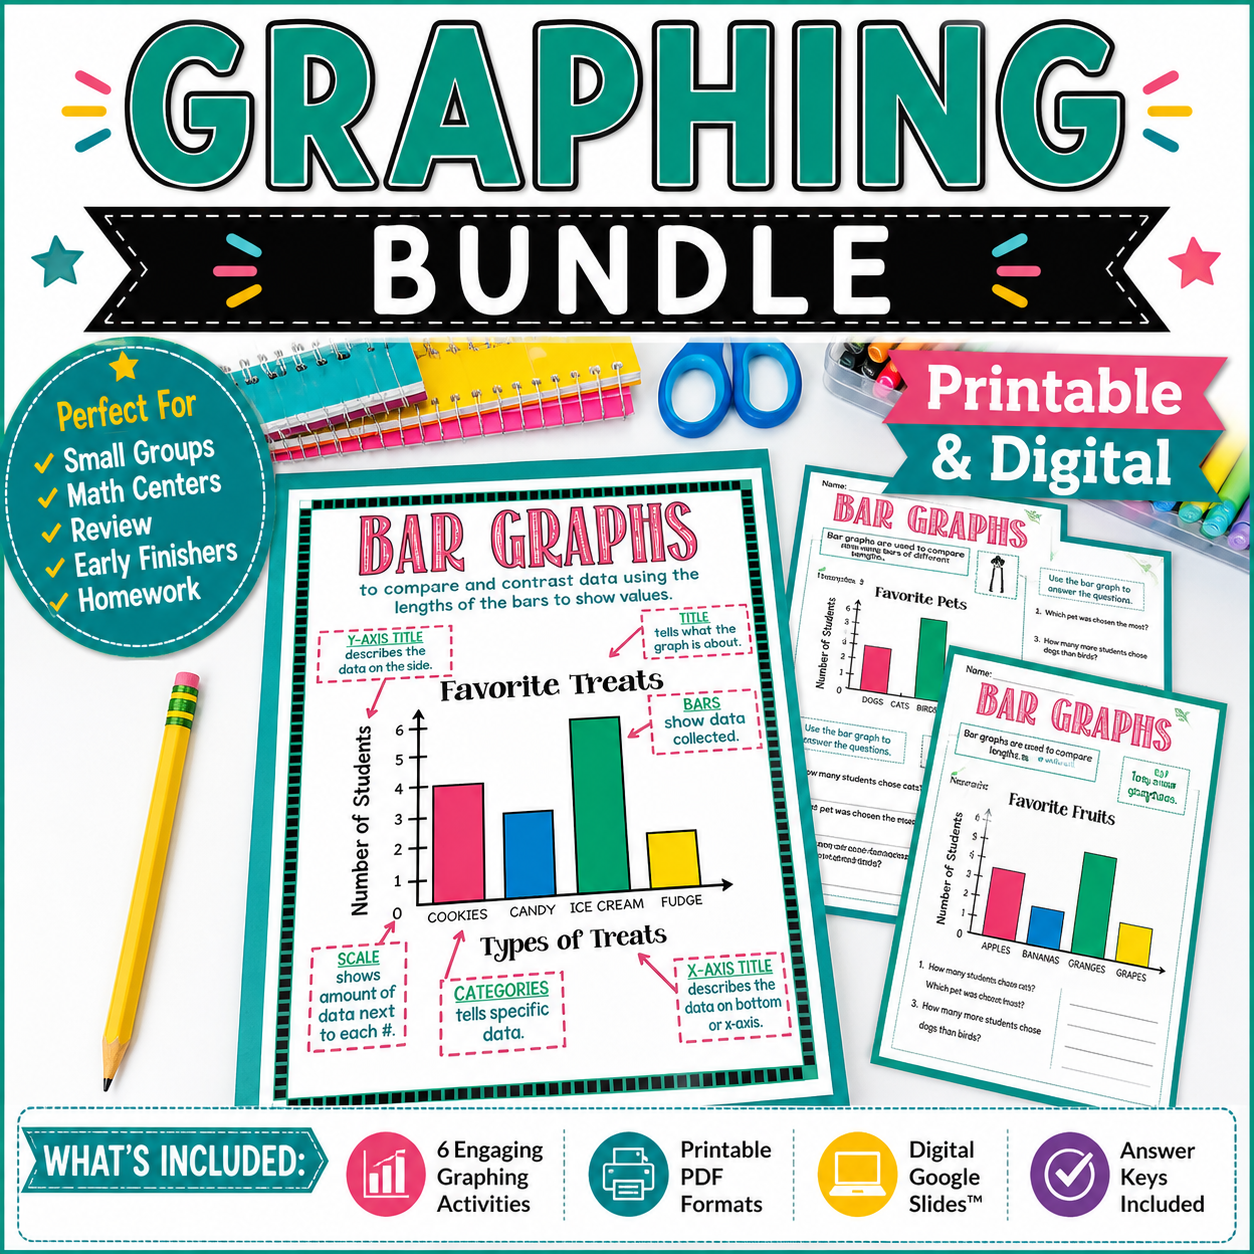
Bar Graphs • Pictographs • Line Plots | Printable + Digital
Your students will LOVE these engaging and hands-on data and graphing activities! Everything you need — printable worksheets, colorful anchor charts, and interactive digital activities — is ready to go to save you valuable planning time.
No prep. Just print and teach!
🎯 What Students Will Learn
Students will:
✔ Draw scaled bar graphs and pictographs to represent data sets with multiple categories
✔ Create and interpret line plots using measurement data (including fractions)
✔ Collect, organize, and analyze data
✔ Solve multi-step word problems using addition and subtraction
✔ Interpret data from a variety of graph types
These activities are differentiated and aligned to Common Core standards.
🖨 PRINTABLE RESOURCES INCLUDED
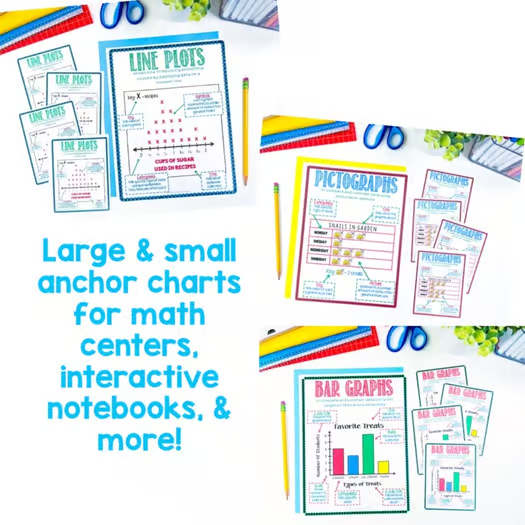
📌 Anchor Charts (Large + Small Versions)
✔ Bar Graph
✔ Pictograph (Picture Graph)
✔ Line Plot
✔ All Graphs Overview
✔ Student-sized anchor charts for interactive notebooks
📈 Worksheets Included
Bar Graphs
✔ 4 Bar Graph Worksheets
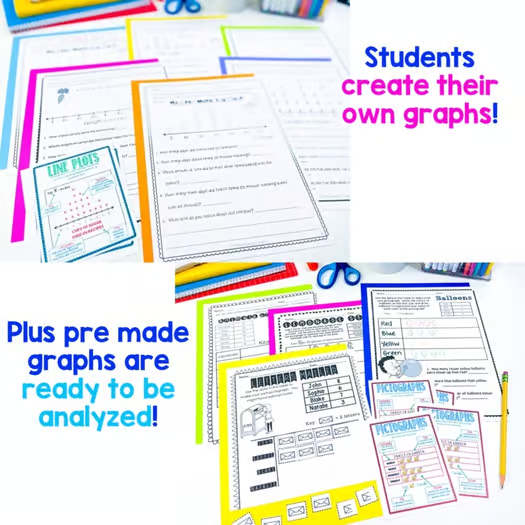
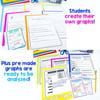
✔ 4 “Create Your Own Bar Graph” Worksheets (using provided data)
Pictographs
✔ 4 Pictograph Worksheets
✔ 4 “Create Your Own Pictograph” Worksheets (using provided data)
Line Plots
✔ 4 Line Plot Worksheets
✔ 4 “Create Your Own Line Plot” Worksheets (using provided data)
Each worksheet includes multi-level questions that meet Common Core standards and promote deeper thinking.
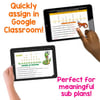
💻 DIGITAL VERSION INCLUDED
Perfect for 1:1 classrooms and distance learning!
✔ Interactive Google Slides versions of every printable worksheet
✔ Answer keys included
✔ 5 pages of detailed instructions for using this resource with:
• Google Drive
• Microsoft OneDrive
• Schoology
• Notability
• Nearpod
• Canvas
• Edmodo
• Blackboard
• Pic Collage
• Padlet
• Evernote
• Seesaw
Flexible and easy to integrate into your digital workflow!
🧠 Skills Covered
✔ Reading and interpreting bar graphs
✔ Reading and interpreting pictographs
✔ Reading and interpreting line plots
✔ Creating scaled graphs
✔ Data analysis
✔ Measurement data in fractions
✔ Solving word problems using data
✔ Tally charts and data organization
Students not only read graphs — they create them and analyze them.
❤️ Why Teachers Love This Resource
⭐️⭐️⭐️⭐️⭐️ Jason B.
“Good resource for students to learn about the parts of different types of graphs, answer questions using graphs, and create their own graphs. Will continue to use this resource in my classroom.”
⭐️⭐️⭐️⭐️⭐️ Staci F.
“These graphs were great to use during our Graphing Unit last spring. The color and topics made the assignments engaging, and I was thrilled I didn’t have to create them myself.”
⭐️⭐️⭐️⭐️⭐️ Lindsey L.
“Teaching pictographs and bar graphs during distance learning was daunting, but this resource is AMAZING. It gives students opportunities to interpret and create graphs.”
⭐️⭐️⭐️⭐️⭐️ Renee F.
“Easy to use and hit all that I needed for different graphs.”
⭐️⭐️⭐️⭐️⭐️ Meghan N.
“Lots of ways to use — great for differentiation!”
✨ Perfect For:
✔ Graphing Units
✔ Whole Group Instruction
✔ Small Groups
✔ Math Centers
✔ Independent Practice
✔ Homework
✔ Distance Learning
✔ Test Prep
✔ Intervention
Save time, boost engagement, and give your students meaningful practice with bar graphs, pictographs, and line plots — all in one comprehensive resource.