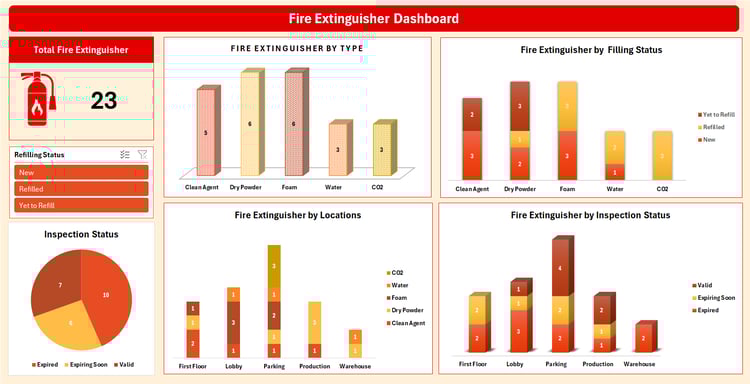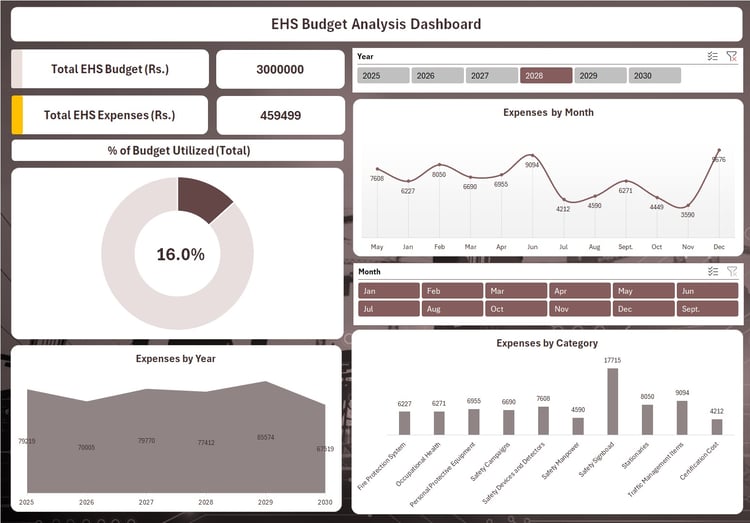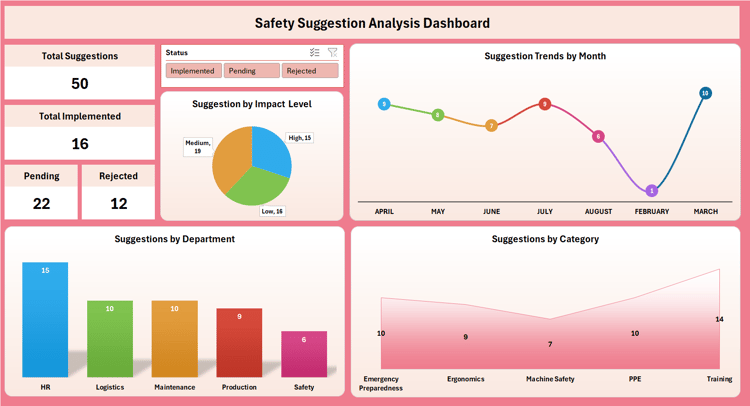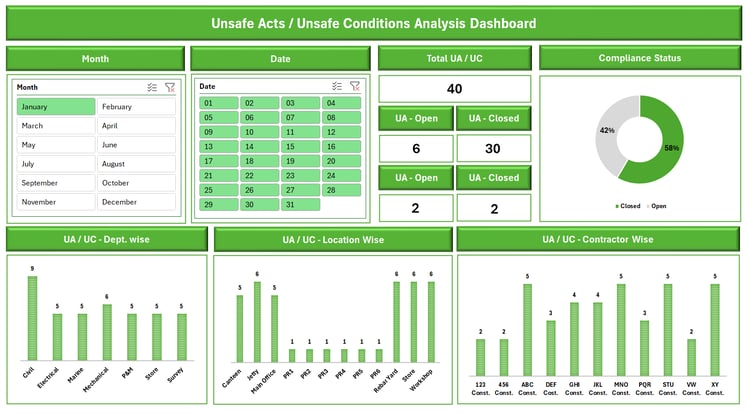
Health & Safety Cross - Excel Template
On Sale
$0.00
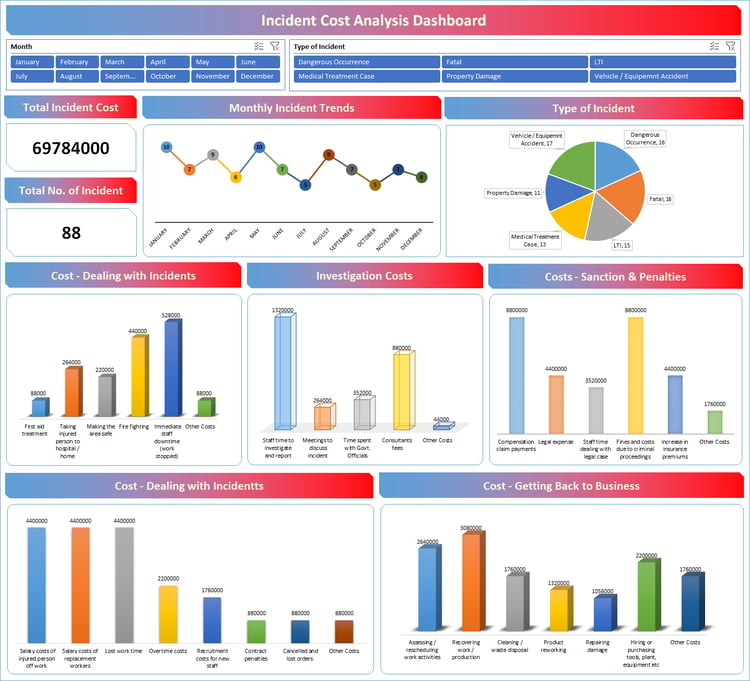
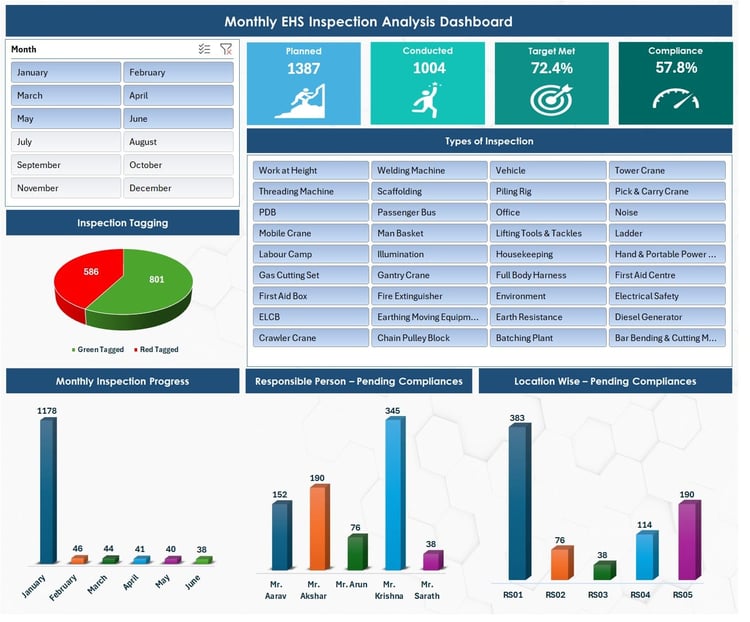
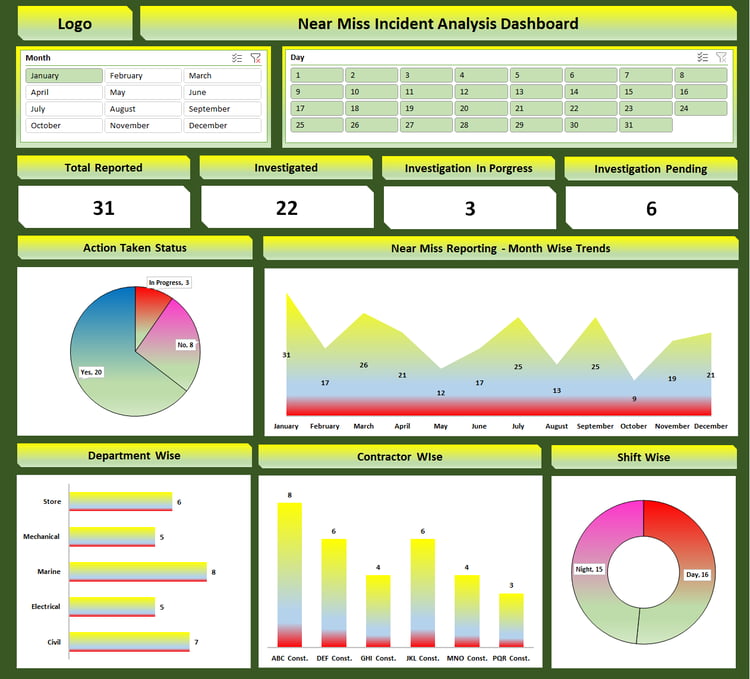
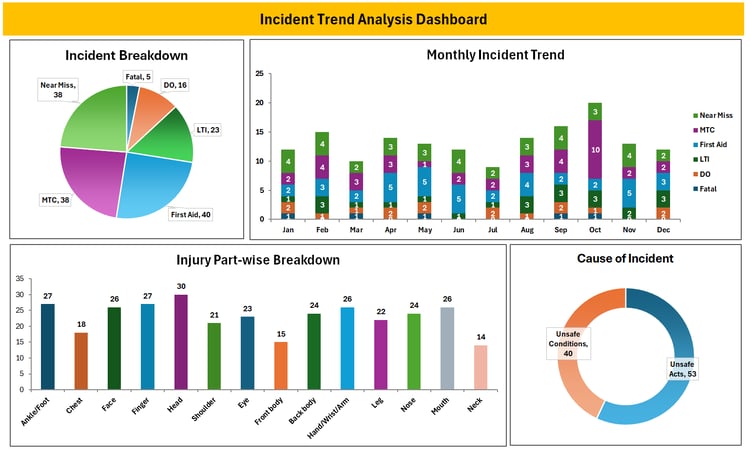
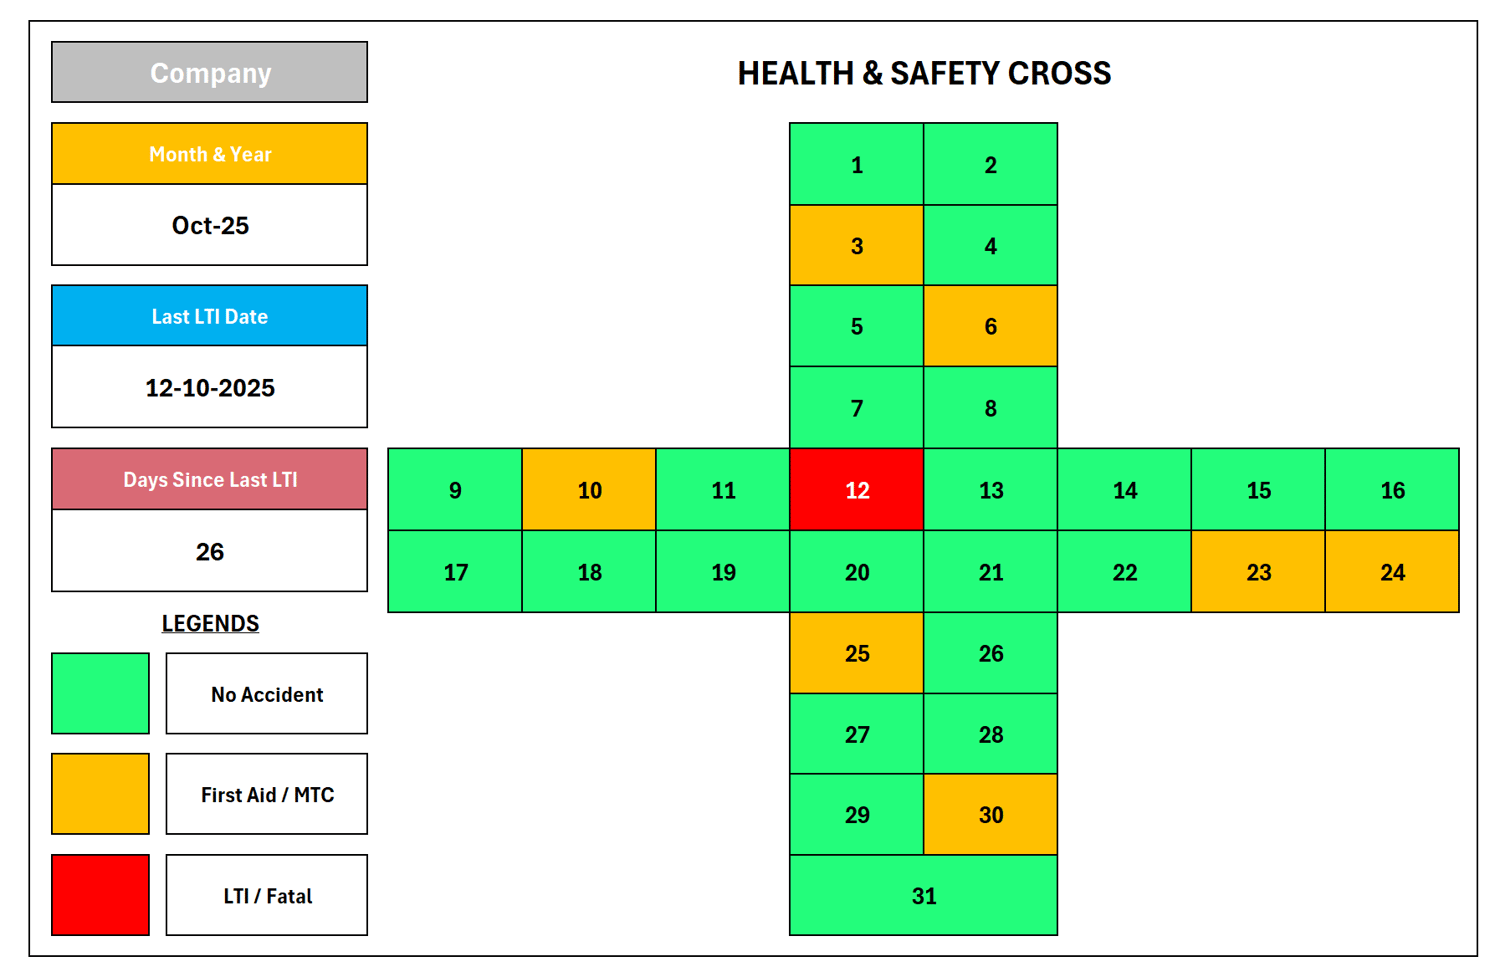
The Health and Safety Cross Dashboard is a powerful visual management tool used to monitor and record workplace safety performance on a daily basis. Each square represents a day of the month, color-coded to show the type of incident or safety outcome that occurred.
- 🟩 Green – No accident or incident
- 🟨 Yellow – First Aid or Minor Treatment Case (MTC)
- 🟥 Red – Lost Time Injury (LTI) or Fatality
This Health and Safety Cross Chart helps organizations track trends, improve safety awareness, and maintain compliance with occupational health and safety (OHS) standards. By reviewing the dashboard regularly, teams can identify risk areas, prevent future incidents, and strengthen their overall workplace safety performance.