

Budget Vs Actuals
On Sale
$15.00
$15.00
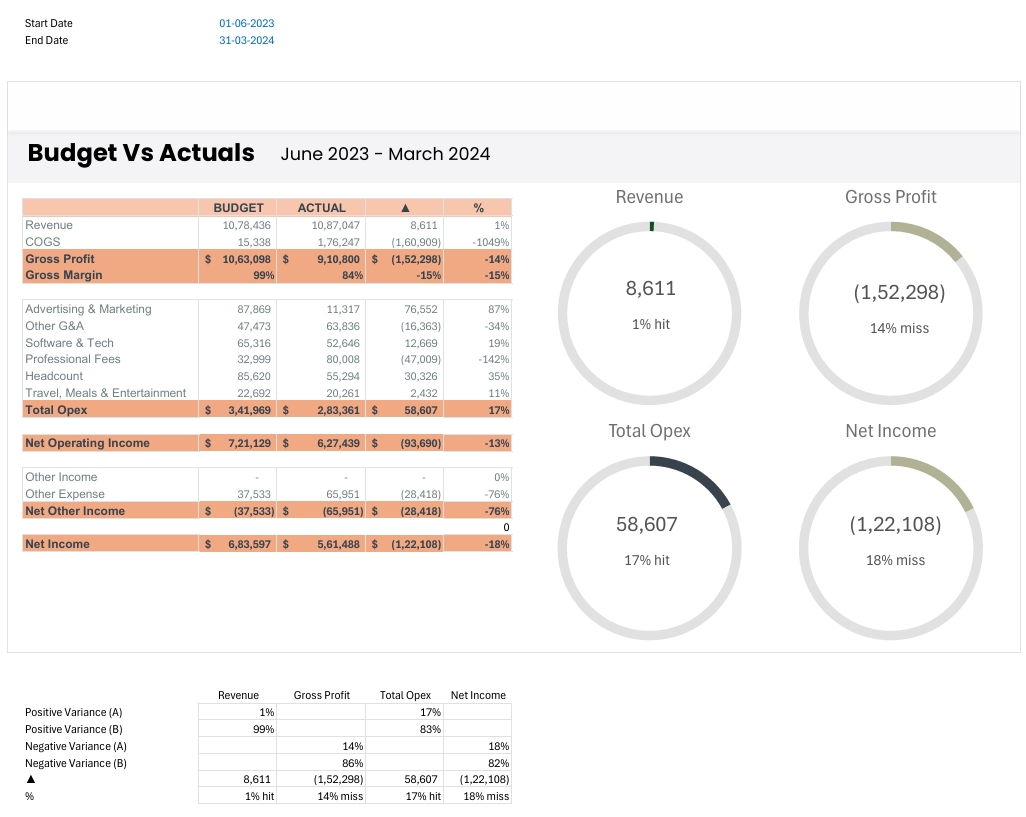
Budget Vs Actuals Dashboard Excel Template
Gain instant, actionable financial insights for your business—no advanced Excel skills required!
Track your financial performance with this powerful Budget Vs Actuals Dashboard, designed for SMEs, startups, and finance professionals who need clarity, speed, and professional reporting. This all-in-one Excel template allows you to compare your planned budgets against actual results, revealing profitability, cost control issues, and new opportunities—all in a single view.
Key Features:
- Comprehensive Variance Analysis: Instantly see where your business is over or under budget for revenue, gross profit, expenses, and net income.
- Visual Performance Indicators: Easy-to-understand charts and dials highlight variances, so you can spot hits and misses at a glance.
- Detailed Expense Tracking: Breaks down costs by category (marketing, tech, headcount, professional fees, and more) for deep operational insight.
- Automated Calculations: All key metrics—like gross margin, opex, and net income—are auto-calculated and formatted for professional presentations or management review.
- Export-Ready & Customizable: Print or upload to reports easily. Adjust categories or timeframes to match your business needs.
Perfect for:
- Business owners, accountants, and finance teams monitoring monthly or quarterly performance
- Startups and SMEs seeking to improve budget discipline and visualize targets vs. results
- Consultants preparing professional, data-driven financial reports
What You Get:
- Ready-to-use Excel template (compatible with all modern versions)
- Instructions tab for setup and data entry
- Pre-built dashboard with interactive visuals and KPI highlights
- Support for customizing to your business model
Make better, faster financial decisions—download your Budget Vs Actuals Dashboard today and stay ahead of your targets!