
MY MATH BUDDY™: Unit 5 – Data, Probability & Statistics
Master data, probability, and statistics with clear, student-friendly notes that turn abstract concepts into simple, visual, meaningful math.
Unit 5, Data, Probability & Statistics, helps learners understand the stories that numbers tell. From interpreting real-world data to predicting outcomes and recognizing trends, this unit builds confidence through guided notes, visual models, and step-by-step examples that make every concept click.
This isn’t memorizing formulas—this is learning how to think with data.
💡 Inside, students will learn how to:
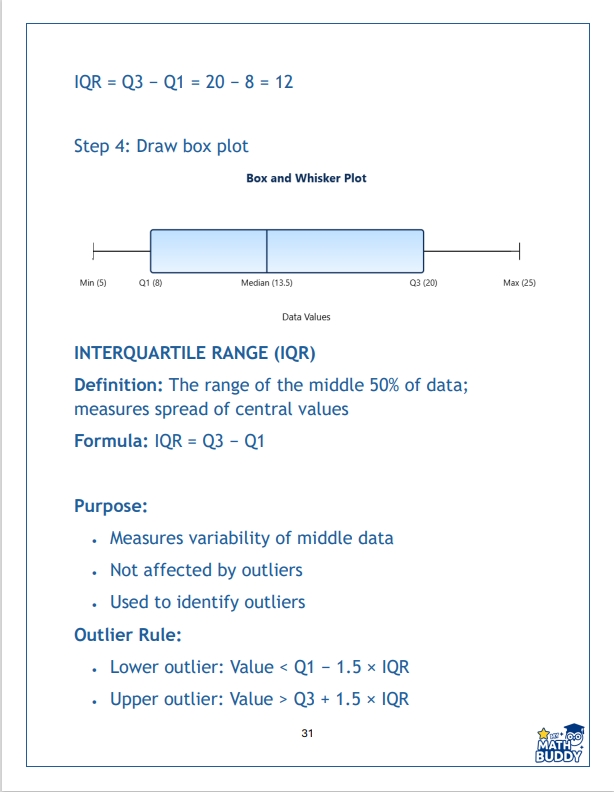
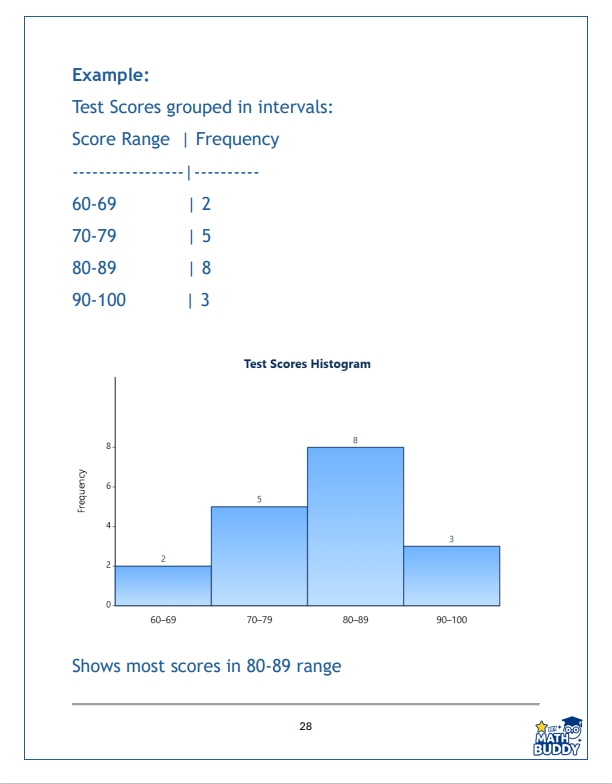
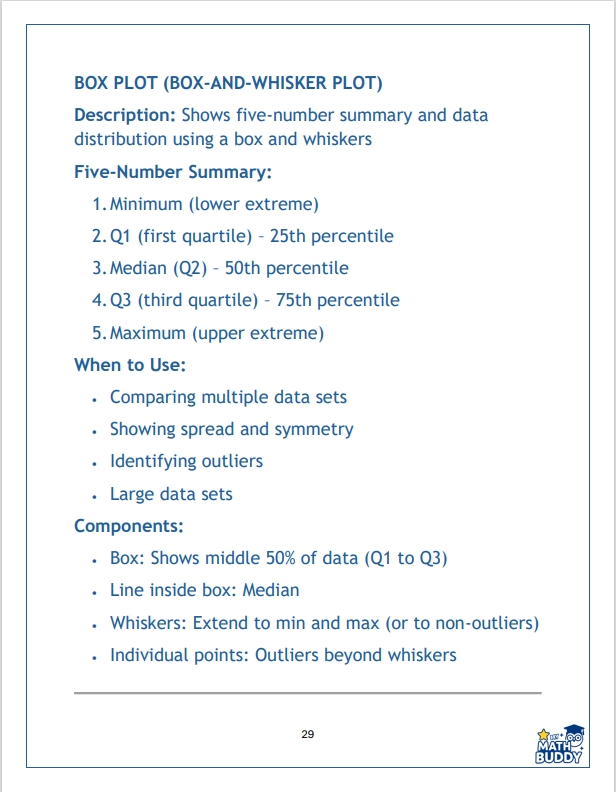
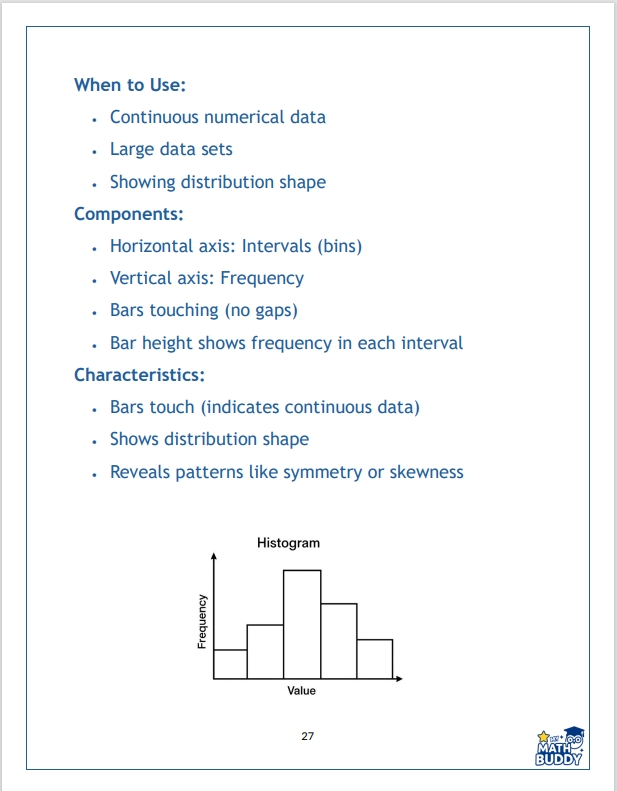
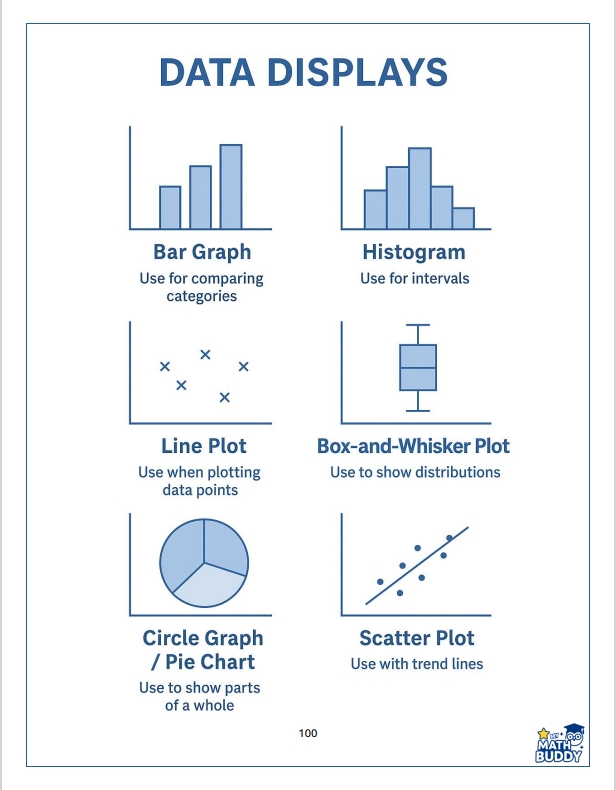
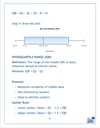
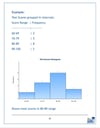
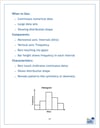
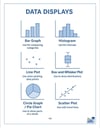
✔️ Read, build, and compare data displays (bar graphs, histograms, box plots, line plots, circle graphs)
✔️ Understand measures of center and spread (mean, median, mode, range, IQR)
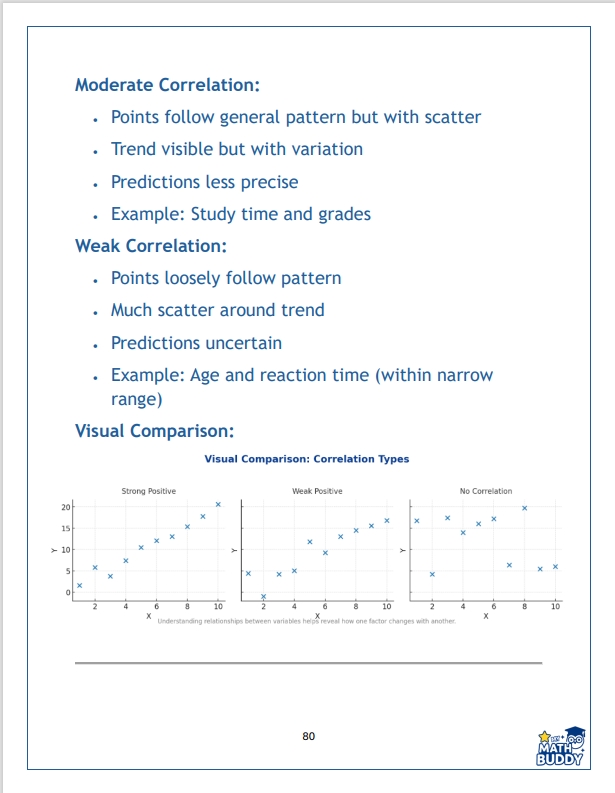
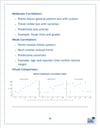
✔️ Construct and interpret scatter plots and trend lines
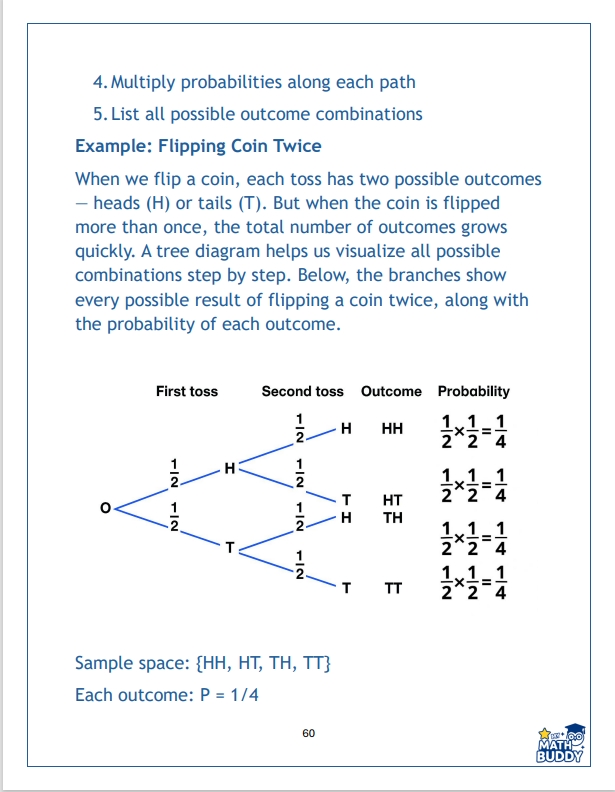
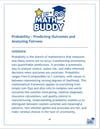
✔️ Use probability models to predict outcomes
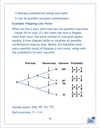
✔️ Work with simple and compound probability
✔️ Analyze patterns to make real-world decisions
🔹 What’s Inside:
- Clear, organized notes designed for grades 6–8
- Visual diagrams for every major data display
- Step-by-step worked examples
- Common error alerts to prevent misconceptions
- Vocabulary tables and formula summaries
- Quick-reference charts for probability and statistics
- Printable study sheets for classroom, tutoring, and homeschool
📦 Includes:
✅ Full-color PDF (8.5x11)
✅ Mobile and tablet friendly
✅ Student-ready explanations (no prep for teachers)
✅ Built-in charts, diagrams, and practice models
This is for you if:
→ You’re a student who needs data and probability explained clearly
→ You’re a teacher or tutor who wants ready-made, accurate notes
→ You’re a parent supporting learning at home
→ You want math that makes sense, not math you memorize and forget
My Math Buddy™ turns data and probability into something students can actually understand and use.
It’s more than notes—it’s a visual learning companion built for confidence, clarity, and real progress.