
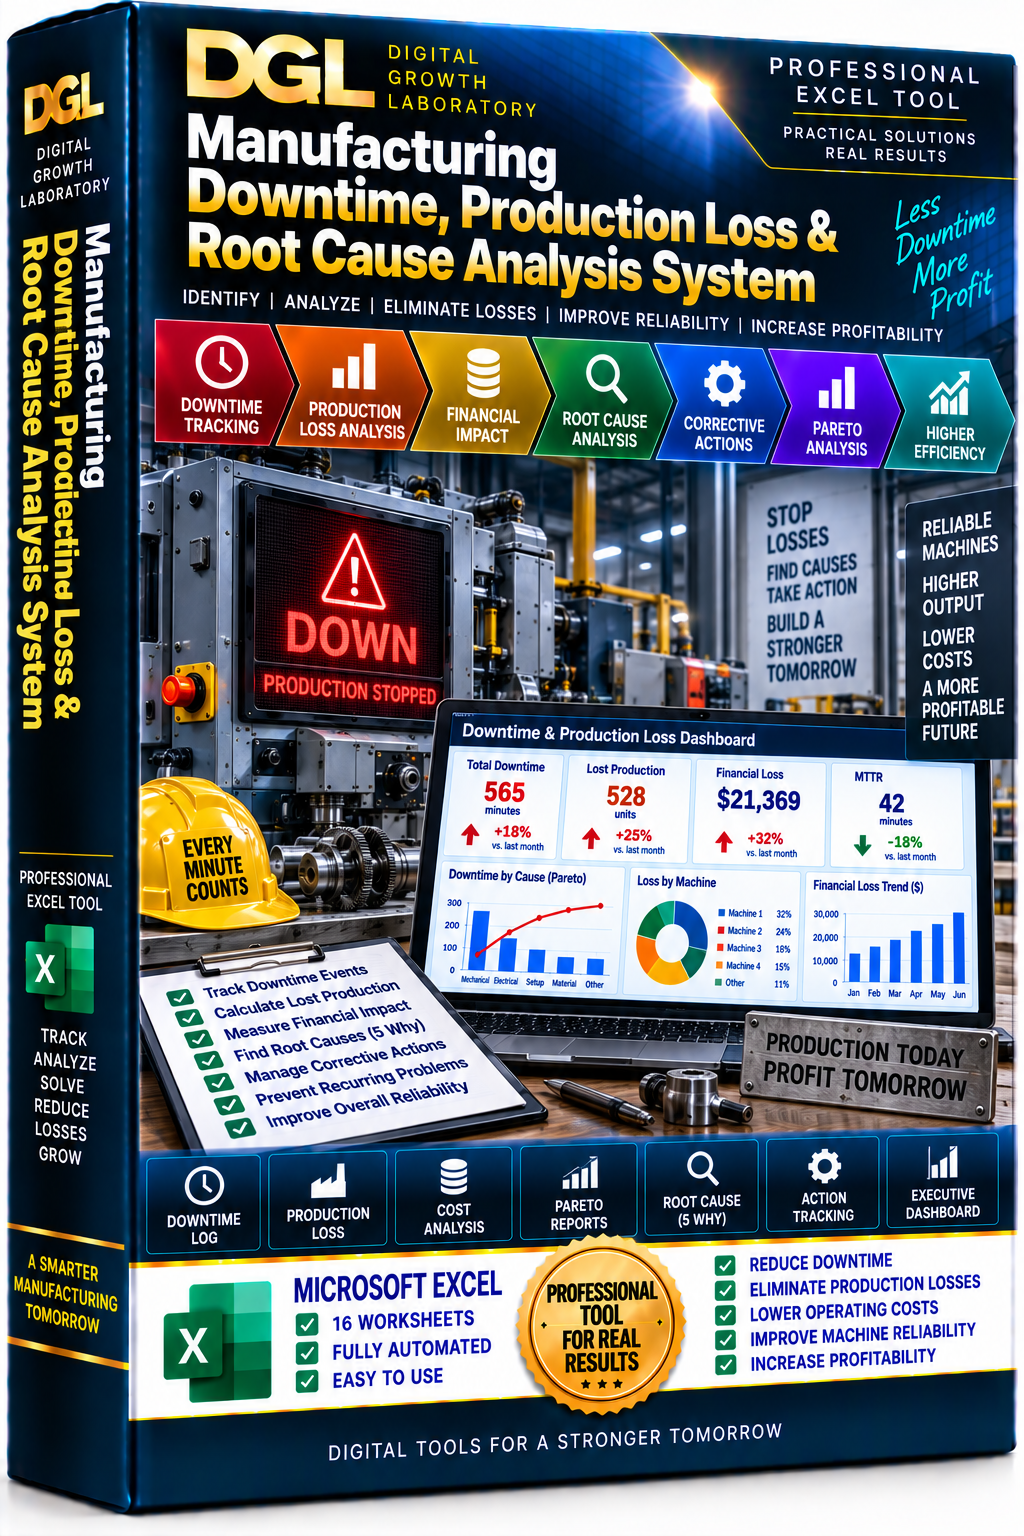
DGL Manufacturing Downtime, Production Loss & Root Cause Analysis System — Professional Excel Tool
DGL Manufacturing Downtime, Production Loss & Root Cause Analysis System is a professional Excel-based management tool designed to help manufacturing companies identify, quantify, analyze and reduce production downtime and operational losses.
The system goes beyond basic downtime tracking by converting production stoppages into measurable lost production, financial impact, root causes, corrective actions and management priorities.
The workbook includes 16 professionally structured and connected worksheets:
• START HERE
• Assumptions
• Asset Register
• Downtime Log
• Loss Classification
• Production Loss
• Financial Impact
• Pareto Analysis
• Root Cause Analysis
• Corrective Actions
• Recurrence Control
• Asset Loss Analysis
• Shift Analysis
• Loss Analysis
• Dashboard
• Instructions
KEY CAPABILITIES
✓ Planned and unplanned downtime tracking
✓ Machine and production-line downtime monitoring
✓ Standardized production loss classification
✓ Automatic downtime-minute calculations
✓ Lost production unit calculations
✓ Production loss quantification
✓ Direct downtime cost analysis
✓ Lost contribution calculations
✓ Financial impact by downtime event
✓ Cost per downtime minute
✓ Asset-level loss analysis
✓ Shift-level downtime analysis
✓ Pareto analysis of major production losses
✓ Root Cause Analysis
✓ 5 Why problem-solving structure
✓ Verified root-cause documentation
✓ Corrective action management
✓ Action ownership and due-date control
✓ Corrective-action effectiveness checks
✓ Repeat-failure and recurrence monitoring
✓ MTTR monitoring
✓ High-risk asset identification
✓ Expected annual savings from corrective actions
✓ Executive Downtime & Production Loss Dashboard
The system helps management answer critical questions:
Which machines and production lines create the greatest downtime losses?
How many production units are being lost because of stoppages?
What is the financial impact of each downtime event?
Which downtime categories are responsible for the majority of losses?
What are the verified root causes behind recurring failures?
Which problems continue to return after corrective actions?
Which assets require immediate management attention?
How much money could corrective actions potentially save?
Which shifts experience the greatest operational losses?
Are corrective actions actually eliminating the causes of downtime?
The Pareto Analysis helps management focus improvement resources on the small number of causes responsible for the largest production and financial losses.
The Root Cause Analysis section provides a structured 5 Why methodology for moving beyond symptoms and identifying verified underlying causes.
The Executive Dashboard provides a centralized management view of downtime minutes, lost production units, financial losses, recurring problems, corrective-action opportunities and expected savings.
Ideal for:
• Manufacturing companies
• Production managers
• Plant managers
• Operations managers
• Maintenance managers
• Reliability engineers
• Industrial engineers
• Continuous Improvement teams
• Lean Manufacturing teams
• Quality teams
• Production supervisors
• Executive management
This is not a simple machine downtime log. It is a structured production-loss management system designed to connect every downtime event with lost output, financial impact, root cause, corrective action and measurable business improvement.
Practical Tools. Real Results.
Digital Growth Laboratory
Business Tools for a Stronger Tomorrow.