

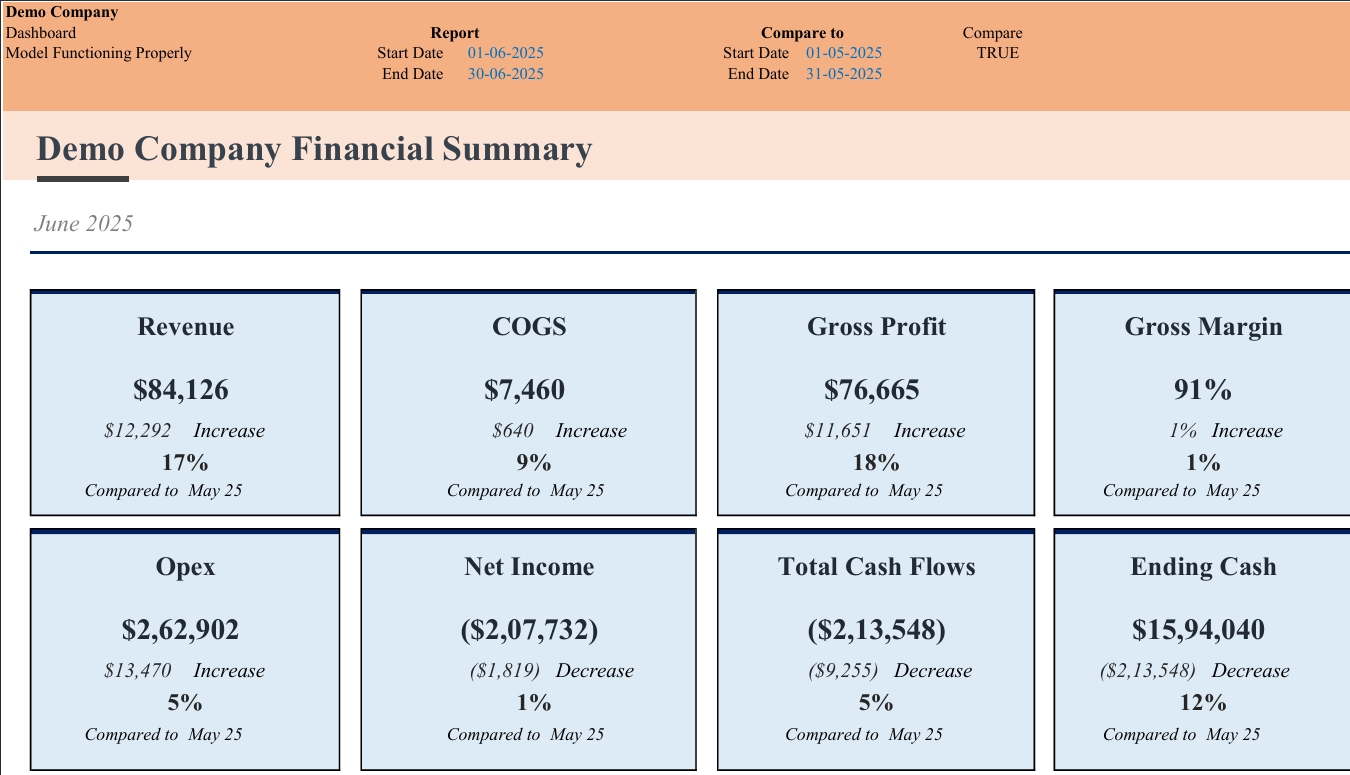
The Financial Summary Dashboard
On Sale
$15.00
$15.00
Financial Summary Dashboard Excel Template:
Gain instant clarity on your business performance with our Monthly Financial Summary Dashboard Excel Template. Perfect for entrepreneurs, SMEs, and finance professionals, this template transforms your month-end reporting into an effortless, insightful process.
Key Features:
- All-in-One Dashboard: View critical KPIs at a glance—revenue, COGS, gross profit, margin, expenses, net income, cash flow, and ending cash, all in one clean, interactive dashboard.
- Automated Variance Analysis: Instantly compare your monthly results to previous periods with clear increases or decreases highlighted, making trend analysis straightforward.
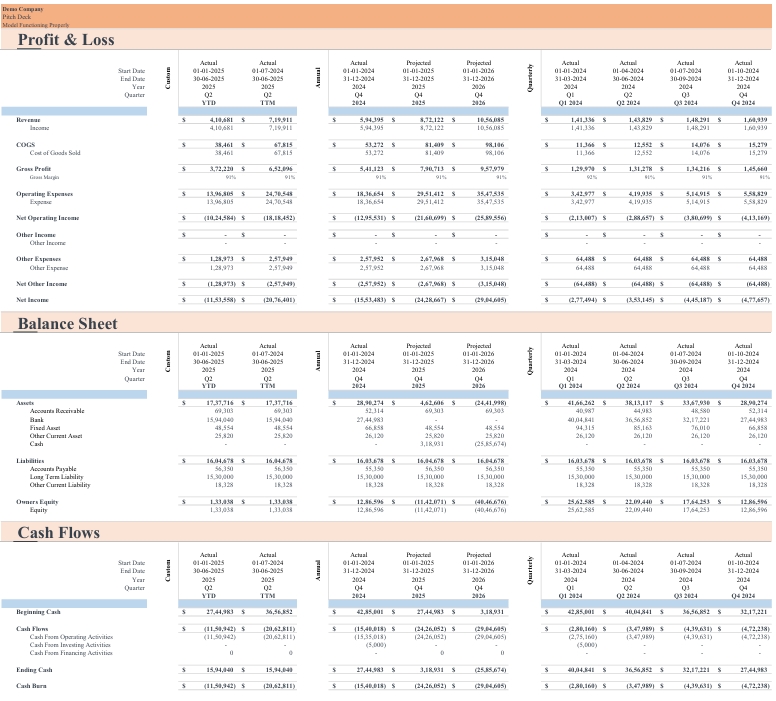
- Detailed Profit & Loss Integration: Dive deeper into your income, expenses, and profitability with linked profit & loss statements, balance sheets, and cash flow statements for comprehensive oversight.
- Professional, Presentation-Ready Design: Impress stakeholders with visually appealing summaries and key metrics formatted for instant understanding.
- Easy Customization: Simply input your business data—automated calculations and charts do the rest. No advanced Excel skills required.
Ideal For:
- Business owners tracking month-to-month progress
- Accountants and consultants preparing client reports
- Startups wanting real-time financial visibility
- Teams needing fast, accurate presentations for decision-making
Stop struggling with spreadsheets—automate your monthly financial reporting and make smarter business decisions with ease!