
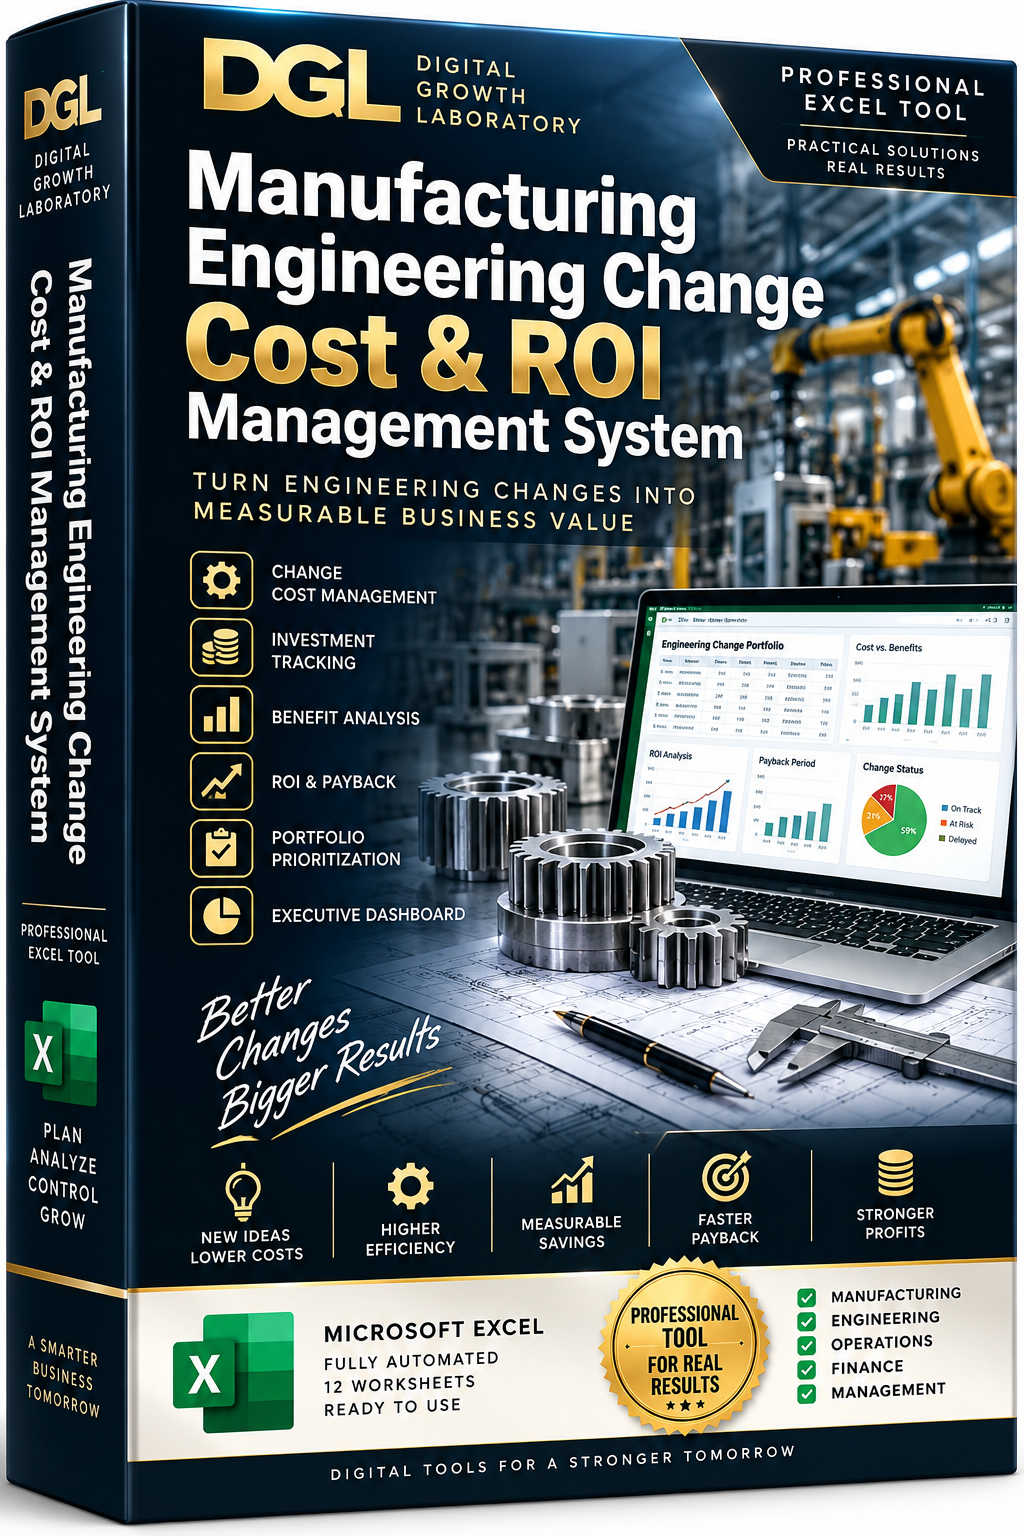
DGL Manufacturing Engineering Change Cost & ROI Management System — Professional Excel Tool
Turn engineering and manufacturing changes into measurable financial decisions.
The DGL Manufacturing Engineering Change Cost & ROI Management System is a professional Excel-based financial management tool designed for manufacturing companies, engineering teams, operations managers, finance teams and plant management that need to understand the true cost, expected value and actual financial return of engineering and production changes.
The system connects the complete financial lifecycle of a manufacturing change:
CHANGE → COST ESTIMATE → ACTUAL COST → EXPECTED BENEFIT → ACTUAL BENEFIT → ROI → PAYBACK → VARIANCE → MANAGEMENT DECISION
KEY CAPABILITIES:
• Engineering Change Financial Management
• Manufacturing Change Cost Tracking
• Change Investment Portfolio
• ECR / ECO Financial Analysis
• Design Change Cost Analysis
• Process Change Cost Analysis
• Supplier Change Financial Analysis
• Tooling Change Investment Analysis
• Equipment Change Cost Analysis
• Estimated Change Investment
• Actual Change Investment
• Engineering Labor Costs
• Production Labor Costs
• Tooling Costs
• Equipment Costs
• Material Costs
• Supplier Costs
• Validation Costs
• Training Costs
• Documentation Costs
• Inventory Obsolescence Costs
• Software Costs
• External Service Costs
• Quantity & Unit Cost Calculations
• Risk Allowance %
• Risk-Adjusted Cost Estimates
• Approved Budget Tracking
• Capital / Expense Classification
• Actual Expenditure Tracking
• Supplier & Resource Tracking
• PO / Financial Reference Tracking
• Automatic Cost Variance
• Expected Benefit Management
• Scrap Reduction Savings
• Labor Savings
• Material Savings
• Purchase Savings
• Quality Improvement Benefits
• Downtime Reduction Benefits
• Setup-Time Reduction
• Throughput Gains
• Energy Savings
• Warranty Reduction
• Baseline vs Expected Performance
• Benefit Value per Unit
• Expected Annual Benefit
• Benefit Confidence %
• Risk-Adjusted Expected Benefit
• Actual Benefit Tracking
• Post-Implementation Benefit Validation
• Provisional / Validated Benefit Status
• Evidence & Reference Tracking
• Automatic Annualized Benefits
• Expected vs Actual Benefit Variance
• Expected ROI %
• Actual ROI %
• Expected Payback Period
• Actual Payback Period
• 3-Year Net Value
• Investment Variance %
• Benefit Variance %
• Cost Overrun Detection
• Benefit Shortfall Detection
• Low ROI Alerts
• Long Payback Alerts
• RED / YELLOW / GREEN Financial Signals
• Management Escalation
• Change Portfolio Prioritization
• Strategic Importance Scoring
• Risk / Complexity Scoring
• Urgency Scoring
• Financial Priority Score
• Management Priority Score
• Automatic Change Ranking
• Executive Financial Dashboard
• Automated Formulas
• Connected Worksheets
• Example Manufacturing Data
• Built-In Operating Instructions
CHANGE PORTFOLIO
The Change Portfolio provides management with a central financial register for engineering, manufacturing, process, supplier, tooling and equipment changes.
For each change, the system tracks:
• Estimated Investment
• Actual Investment
• Expected Annual Benefit
• Actual Annualized Benefit
• Expected ROI
• Actual ROI
• Expected Payback
• Actual Payback
• Financial Status
COST ESTIMATE
The Cost Estimate module helps build the complete financial baseline before implementation.
Costs can include engineering labor, production labor, tooling, equipment, materials, suppliers, validation, training, documentation, obsolete inventory, software and external services.
Risk allowances can be applied to individual cost items to calculate a risk-adjusted investment estimate.
ACTUAL COSTS
The Actual Costs module records real expenditure after the change begins.
Management can compare actual expenditure against approved budgets and immediately identify cost overruns.
EXPECTED BENEFITS
The Expected Benefits module converts operational improvements into financial value.
Benefits can be created from:
• Reduced Scrap
• Reduced Rework
• Labor Savings
• Material Savings
• Purchasing Savings
• Reduced Downtime
• Reduced Setup Time
• Increased Throughput
• Energy Savings
• Warranty Reduction
• Other Quantifiable Improvements
The system calculates expected annual financial benefit and allows a confidence factor to create a risk-adjusted benefit estimate.
ACTUAL BENEFITS
The Actual Benefits module tracks measurable post-implementation results.
Each benefit can be classified as provisional, validated, rejected or pending and linked to supporting evidence.
Observed benefits are automatically annualized to provide management with an updated view of the financial performance of the change.
ROI & PAYBACK ANALYSIS
The ROI Analysis compares the original business case against actual results.
It automatically calculates:
• Expected Investment
• Actual Investment
• Expected Annual Benefit
• Actual Annualized Benefit
• Expected ROI
• Actual ROI
• Expected Payback Period
• Actual Payback Period
• Expected 3-Year Net Value
• Actual 3-Year Net Value
• Investment Variance
• Benefit Variance
VARIANCE & MANAGEMENT ALERTS
The system automatically identifies changes with:
• Cost Overruns
• Benefit Shortfalls
• Low ROI
• Long Payback Periods
RED / YELLOW / GREEN management signals help focus attention on changes requiring financial review.
PORTFOLIO PRIORITIZATION
When multiple engineering or manufacturing changes compete for investment, the Portfolio Prioritization module combines financial value with strategic importance, urgency and implementation risk.
The system produces an automatic priority score and ranking to support management investment decisions.
EXECUTIVE DASHBOARD
The Executive Dashboard provides immediate visibility into:
• Total Active Changes
• Total Actual Investment
• Annualized Financial Benefits
• Average Actual ROI
• Financial Alerts
• Expected vs Actual Investment
• Expected vs Actual Benefits
• Payback Performance
• Portfolio Priority
• Cost Overruns
• Benefit Shortfalls
• Management Decision Signals
The system helps management answer critical questions:
How much will this engineering change really cost?
What costs were originally expected?
How much have we actually spent?
What financial benefit was promised?
What benefit has actually been achieved?
Is the change generating the expected ROI?
When will the investment pay for itself?
Which changes are exceeding their budgets?
Which changes are failing to deliver expected savings?
Which proposed changes provide the strongest financial value?
Where should management invest first?
The result is a structured financial management system that connects engineering and manufacturing decisions with measurable business value.
DIGITAL PRODUCT:
Microsoft Excel (.xlsx)
PRODUCT LINE:
DGL Professional Tools
BRAND:
Digital Growth Laboratory
IMPORTANT:
This workbook is an internal management and financial decision-support tool. It does not constitute accounting, tax, investment, engineering, legal or regulatory advice and does not guarantee savings, ROI, profitability or project success. Financial results depend on the accuracy of the assumptions and actual benefit evidence entered by the user.