

Executive Financial Dashboard
On Sale
$10.00
$10.00
Executive Financial Dashboard for Excel
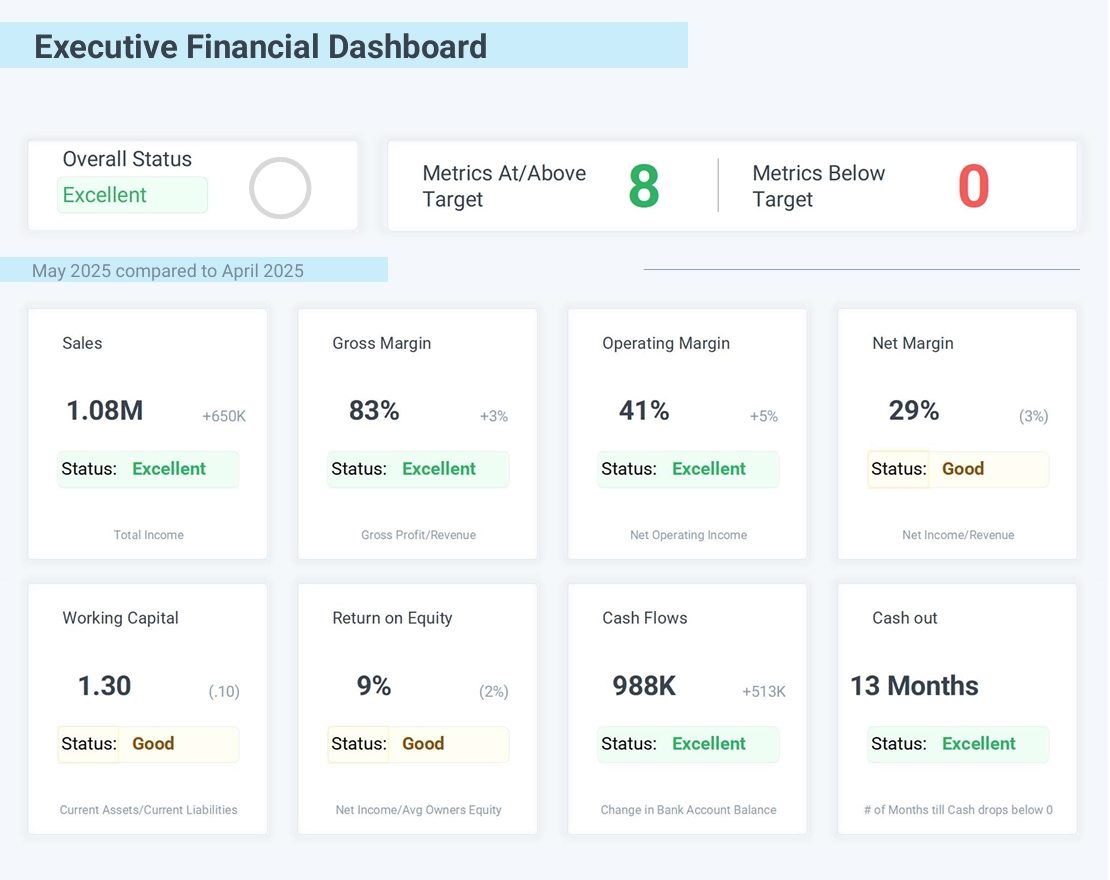
See Your Business Health Instantly—Every Month
The Executive Financial Dashboard template offers a powerful, all-in-one snapshot of your business’s monthly financial health. Designed for entrepreneurs, executives, and finance professionals, it brings clarity and decision support with zero spreadsheet complexity.
Key Features
- Comprehensive Overview:
- Instantly assess critical metrics like Sales, Gross Margin, Operating Margin, Net Margin, Working Capital, Cash Flows, and Return on Equity—all compared side by side for your chosen months.
- Automated Status Indicators:
- Each metric—such as Sales, Gross Margin, Net Margin—displays easy “Excellent / Good / Critical” status, so you know where to focus at a glance.
- Current vs. Comparison Period:
- Effortlessly compare this month’s numbers to the previous month to spot trends, improvements, or areas that need attention.
- Visual Progress:
- At the top, see metrics “At or Above Target” and “Below Target”—helping you evaluate overall business performance.
- Simple Inputs, Clear Outputs:
- Just edit highlighted (blue) input cells—your dashboard instantly updates with numbers, charts, and color-coded feedback.
- KPI Calculations Included:
- Metrics encompass Total Income, Gross Profit/Revenue, Net Operating Income, Net Income/Revenue, Current Assets/Liabilities, and more, using your real business data.
Why Users Love It
- Saves Time: No formulas to write or charts to build—just enter data, and the dashboard does the rest.
- Actionable Insights: Instantly see which areas are thriving and where action is needed.
- Boardroom & Client Ready: Easy-to-read layout makes this dashboard ideal for internal reporting, investor updates, and monthly reviews.
- Customizable: Tailor thresholds, KPIs, and visual formatting to fit your business’s unique needs.
Work smarter—download your Executive Financial Dashboard and transform complex data into clear business direction, every month!