

The Ultimate Financial Dashboard
On Sale
$15.00
$15.00
Financial Dashboard Excel Template: All-in-One Business Insights
Take control of your business finances with our comprehensive Financial Dashboard Excel Template. Designed for startups, small businesses, and finance teams, this template makes it easy to analyze your financial performance at a glance.
Key Features:
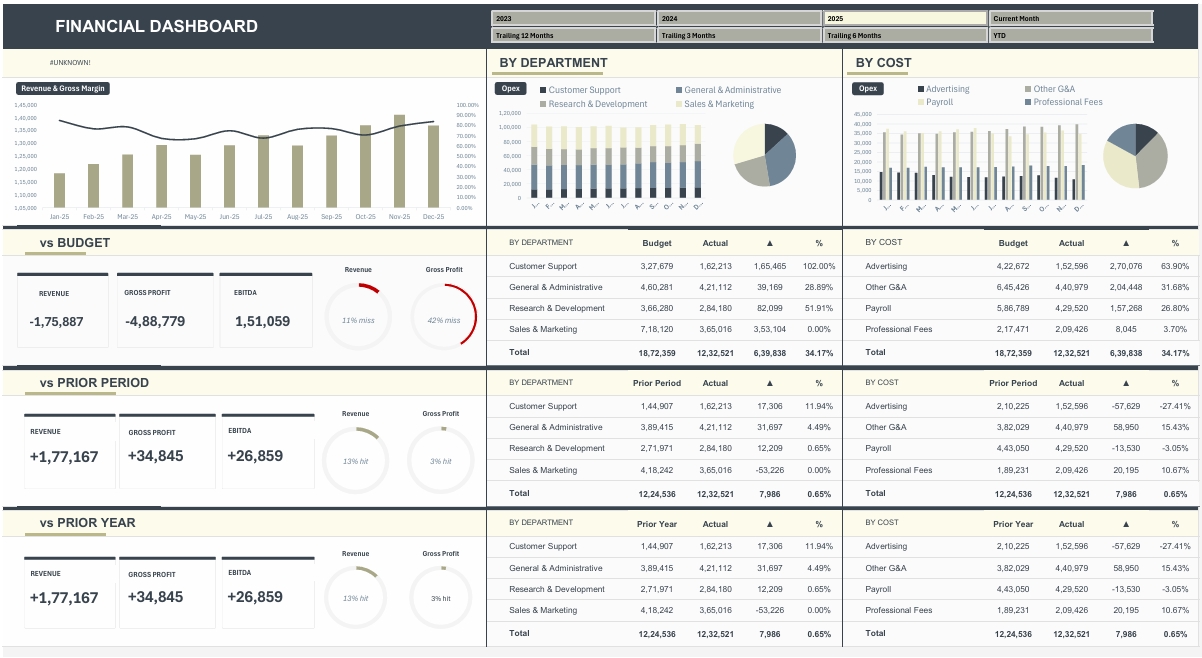
- Revenue & Gross Margin Analysis: Instantly visualize trends with clear charts—see growth, dips, and profitability month-over-month.
- Budget Tracking: Compare actual performance vs. budget, prior periods, and previous year for revenue, gross profit, and EBITDA.
- Department & Cost Breakdown: Monitor and manage expenses across departments (Customer Support, R&D, Marketing, G&A) with intuitive bar and pie charts.
- Actionable KPIs: Spot key metrics like revenue variance and gross margin hits or misses, so you can make informed decisions fast.
- Easy-to-Use & Customizable: Plug in your data and the dashboard updates automatically. No advanced Excel skills required.
- Professional Design: Clean, modern visuals help you impress stakeholders and team members in presentations or reports.
Perfect For:
- Small business owners who need to monitor business health
- Startups seeking clear financial oversight
- Finance managers and consultants delivering reports to clients
- Entrepreneurs preparing for investor meetings or internal reviews
Stop manual number crunching and start making smarter business decisions today!
Would you like a shorter or more technical version, or perhaps a version focused on a specific industry? Let me know your preference!