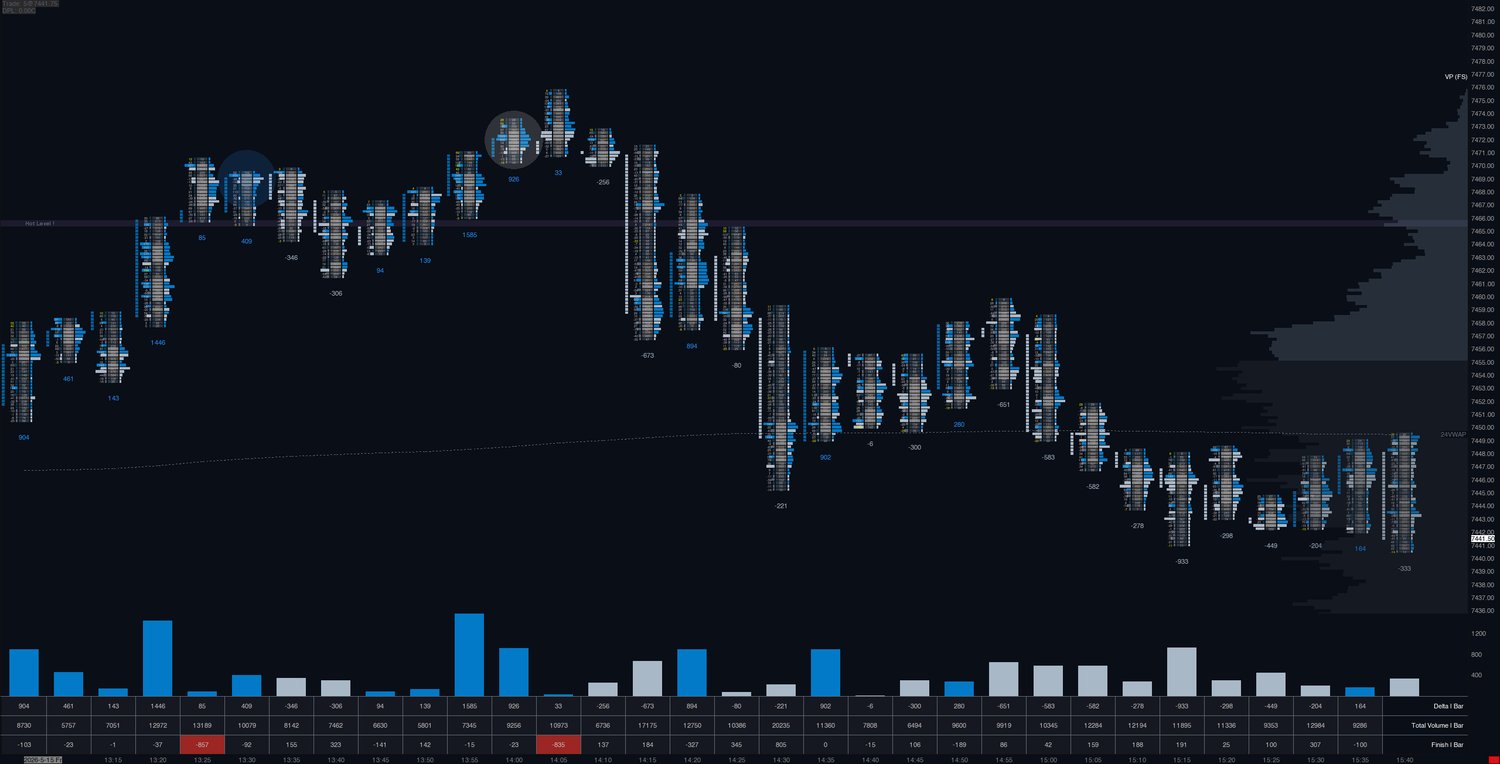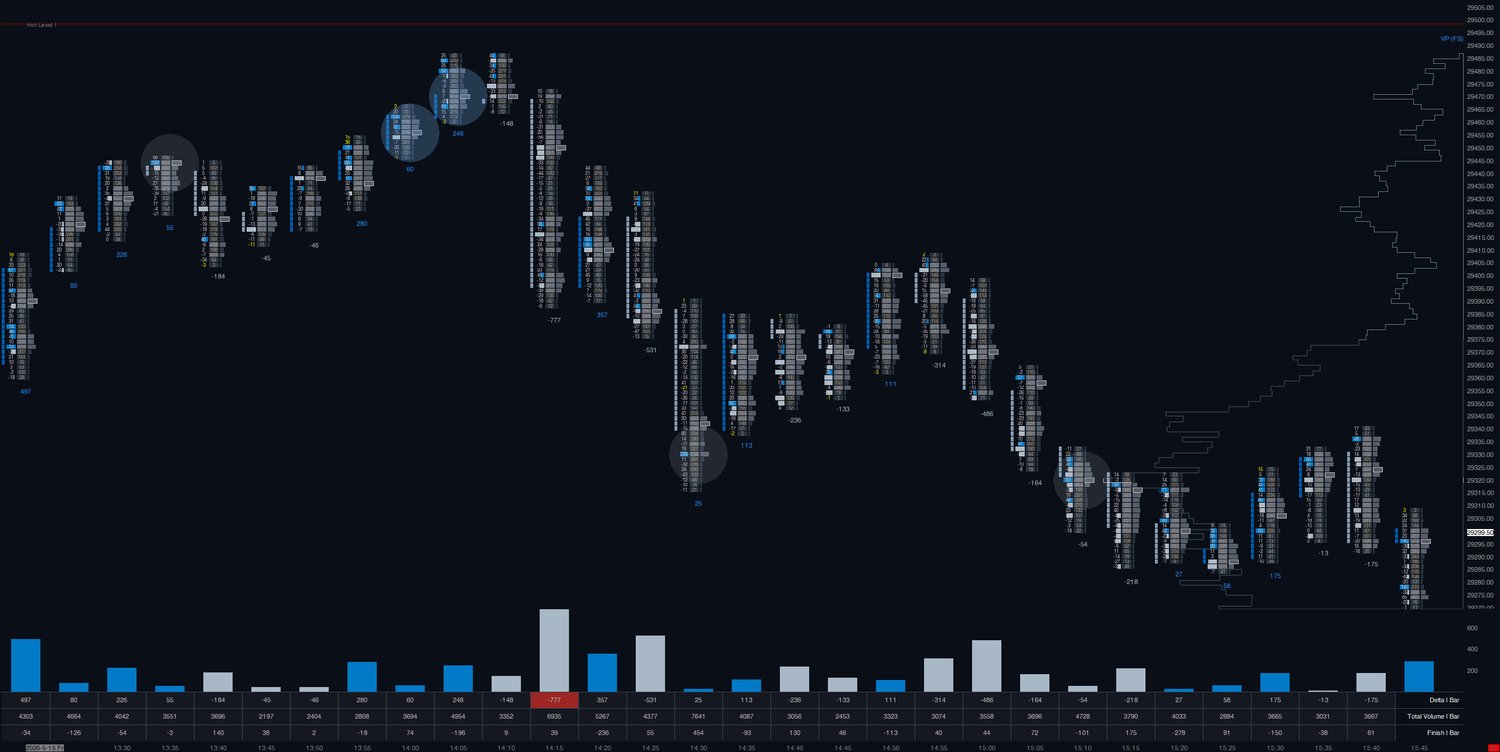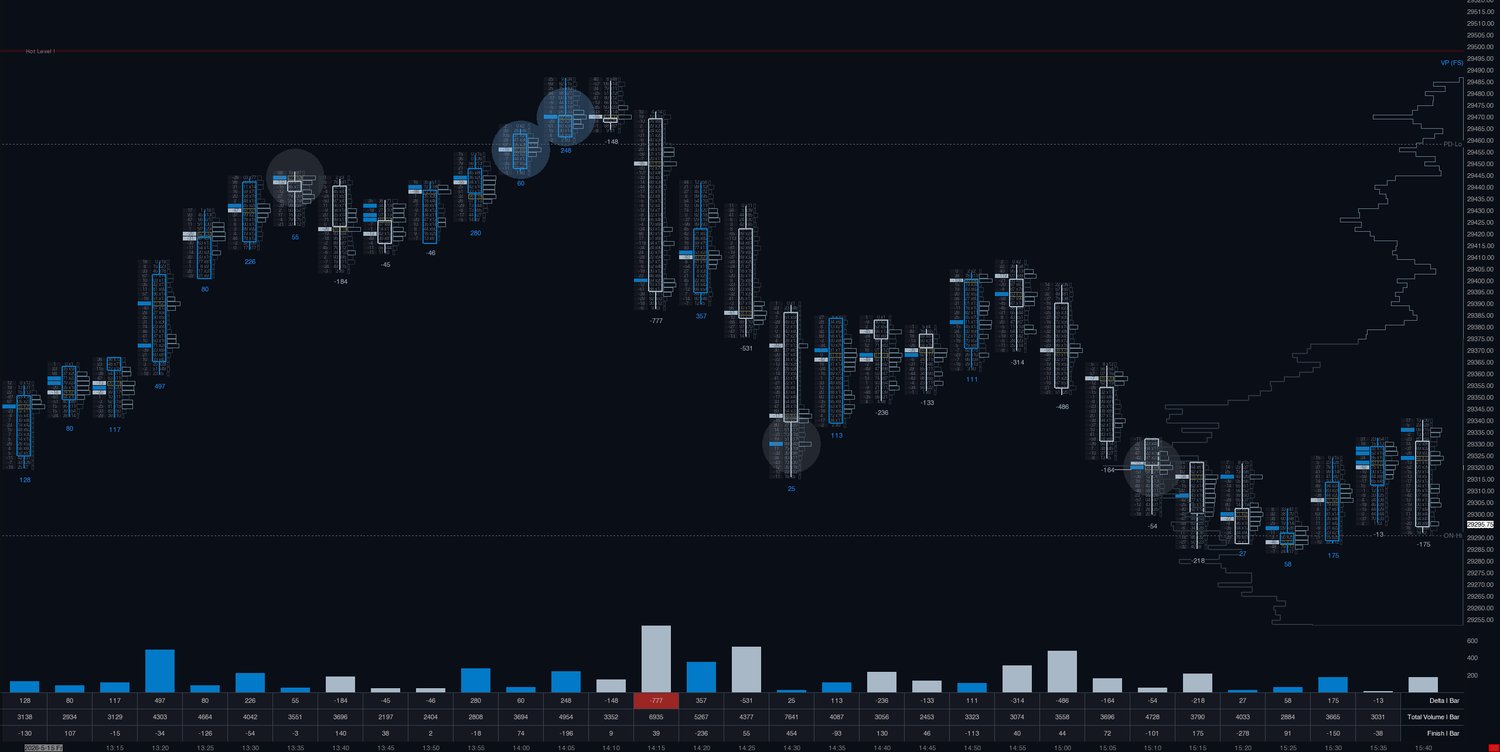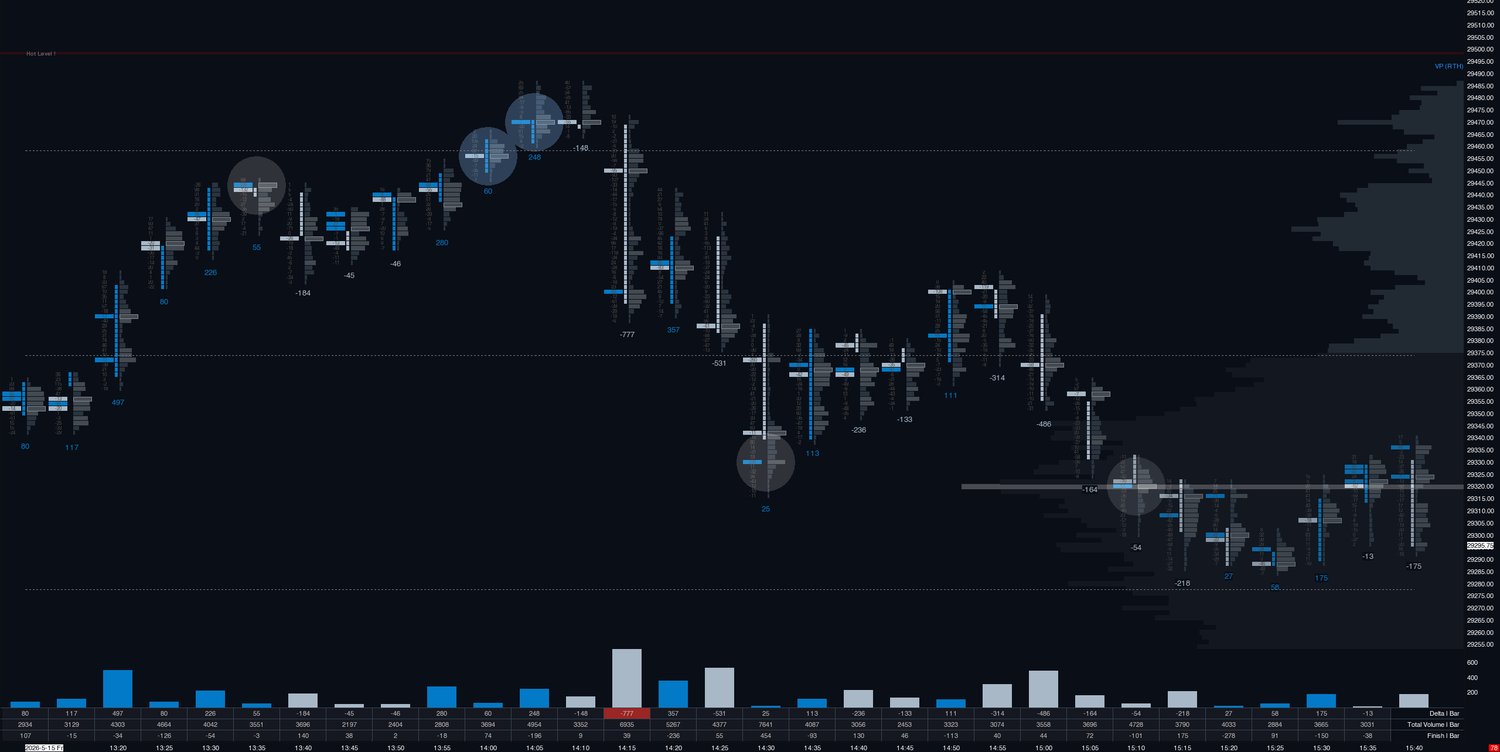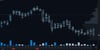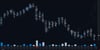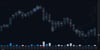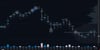
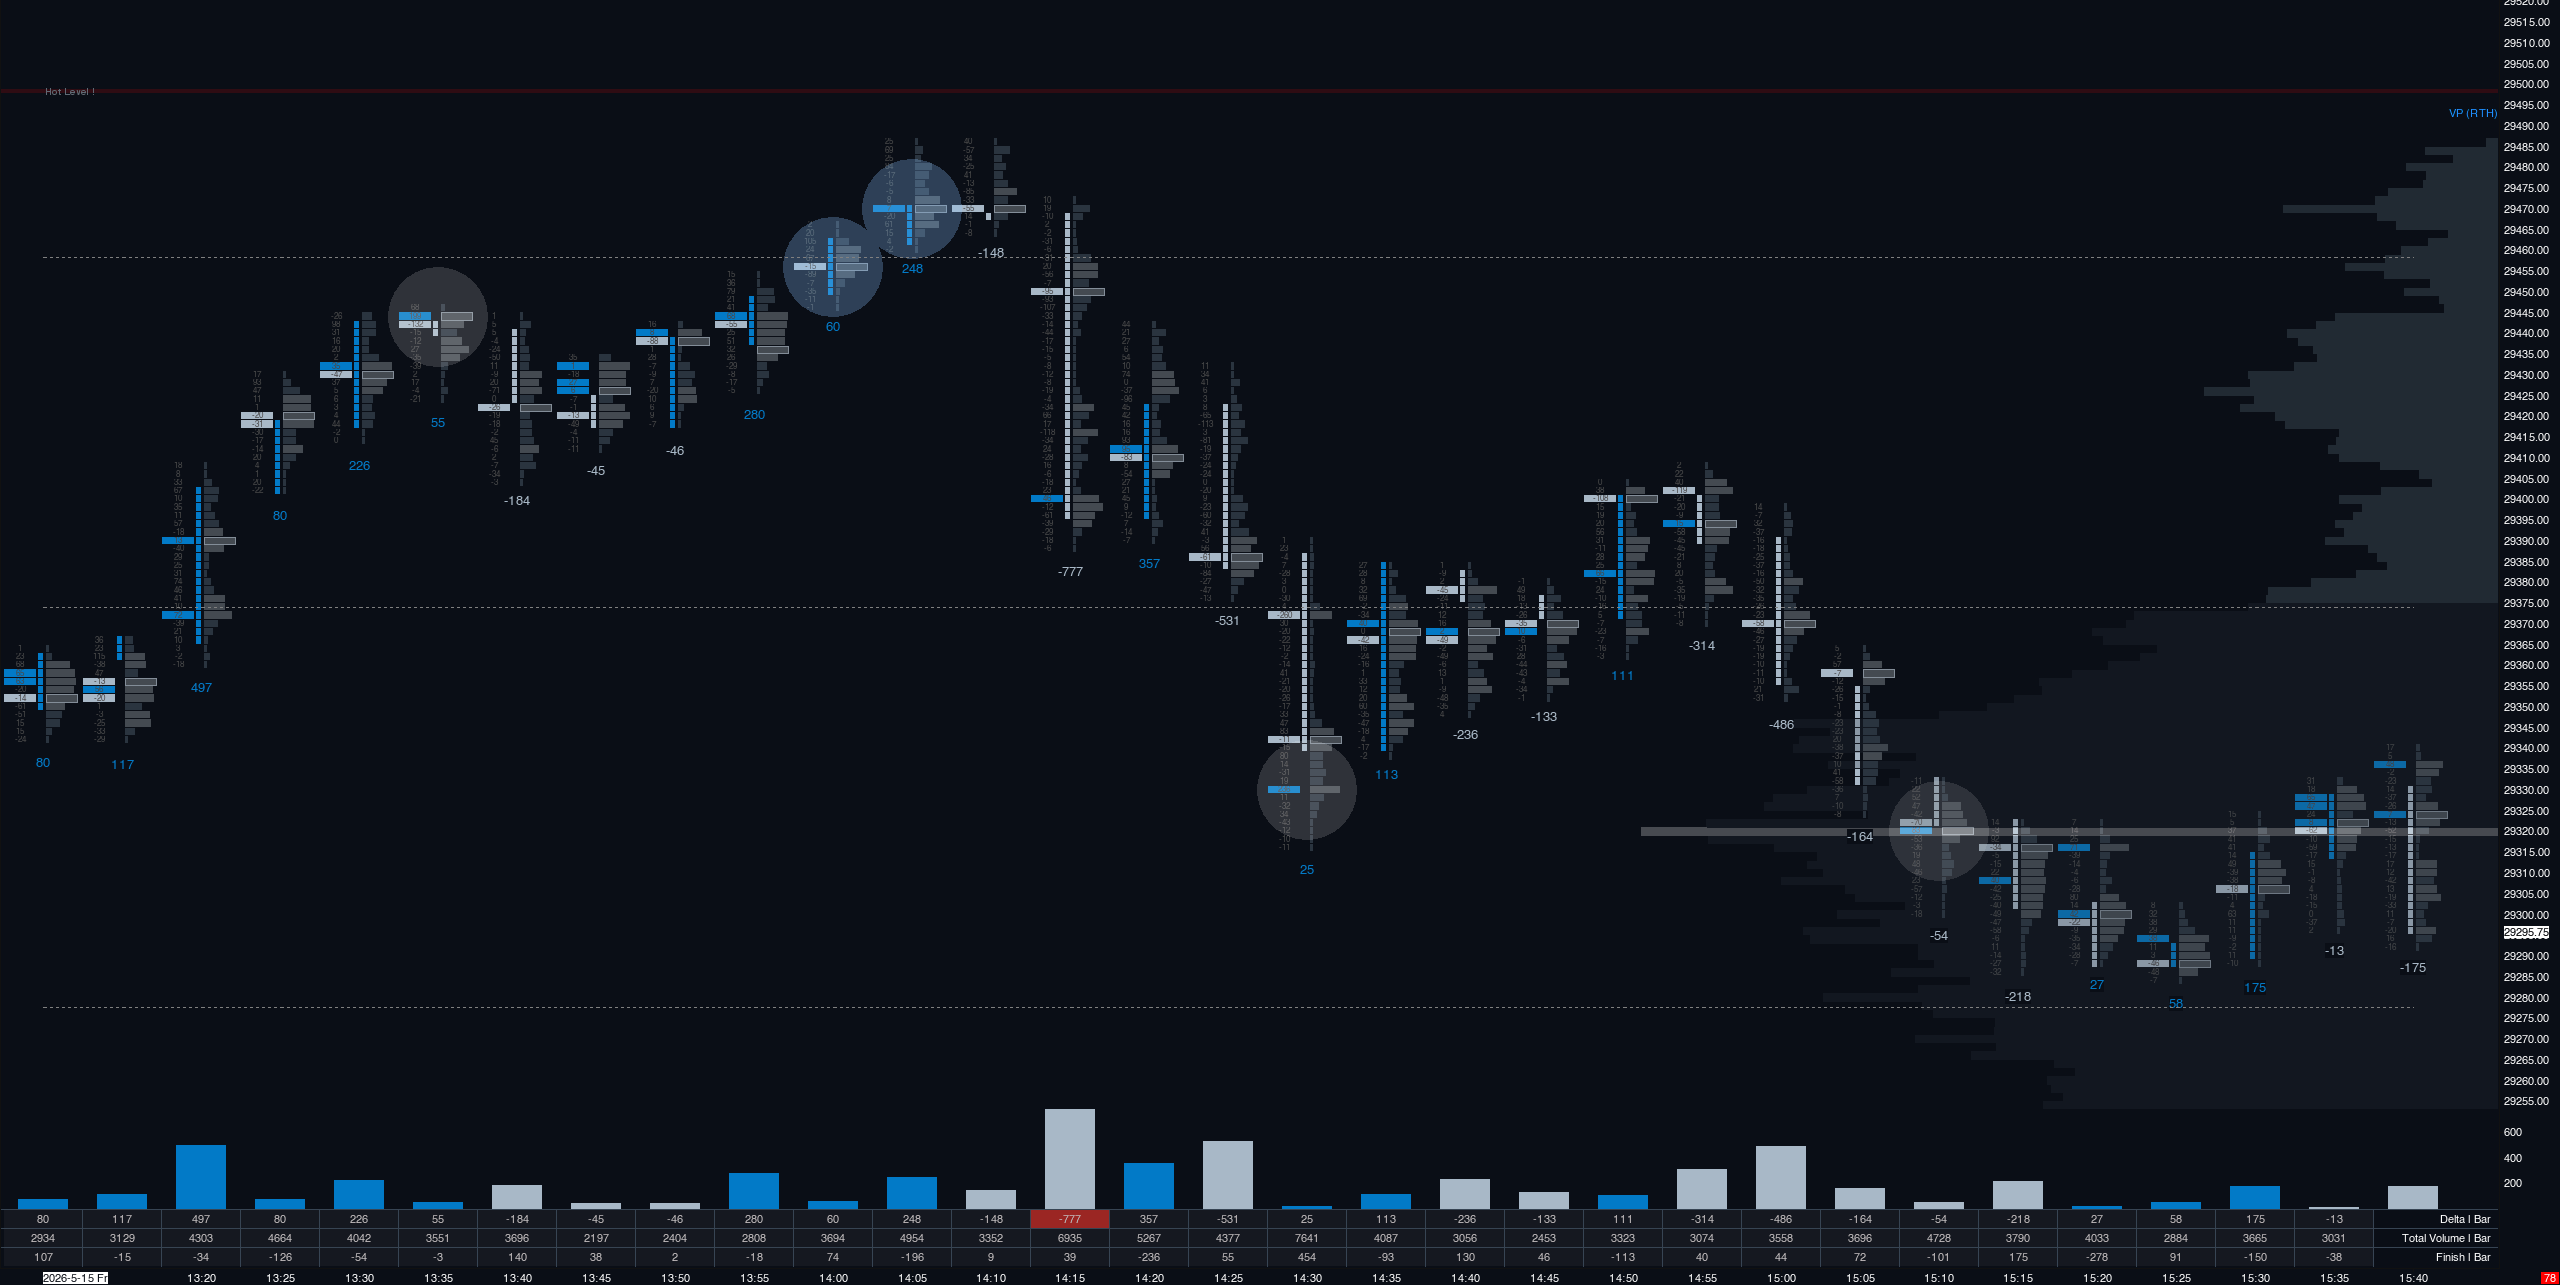
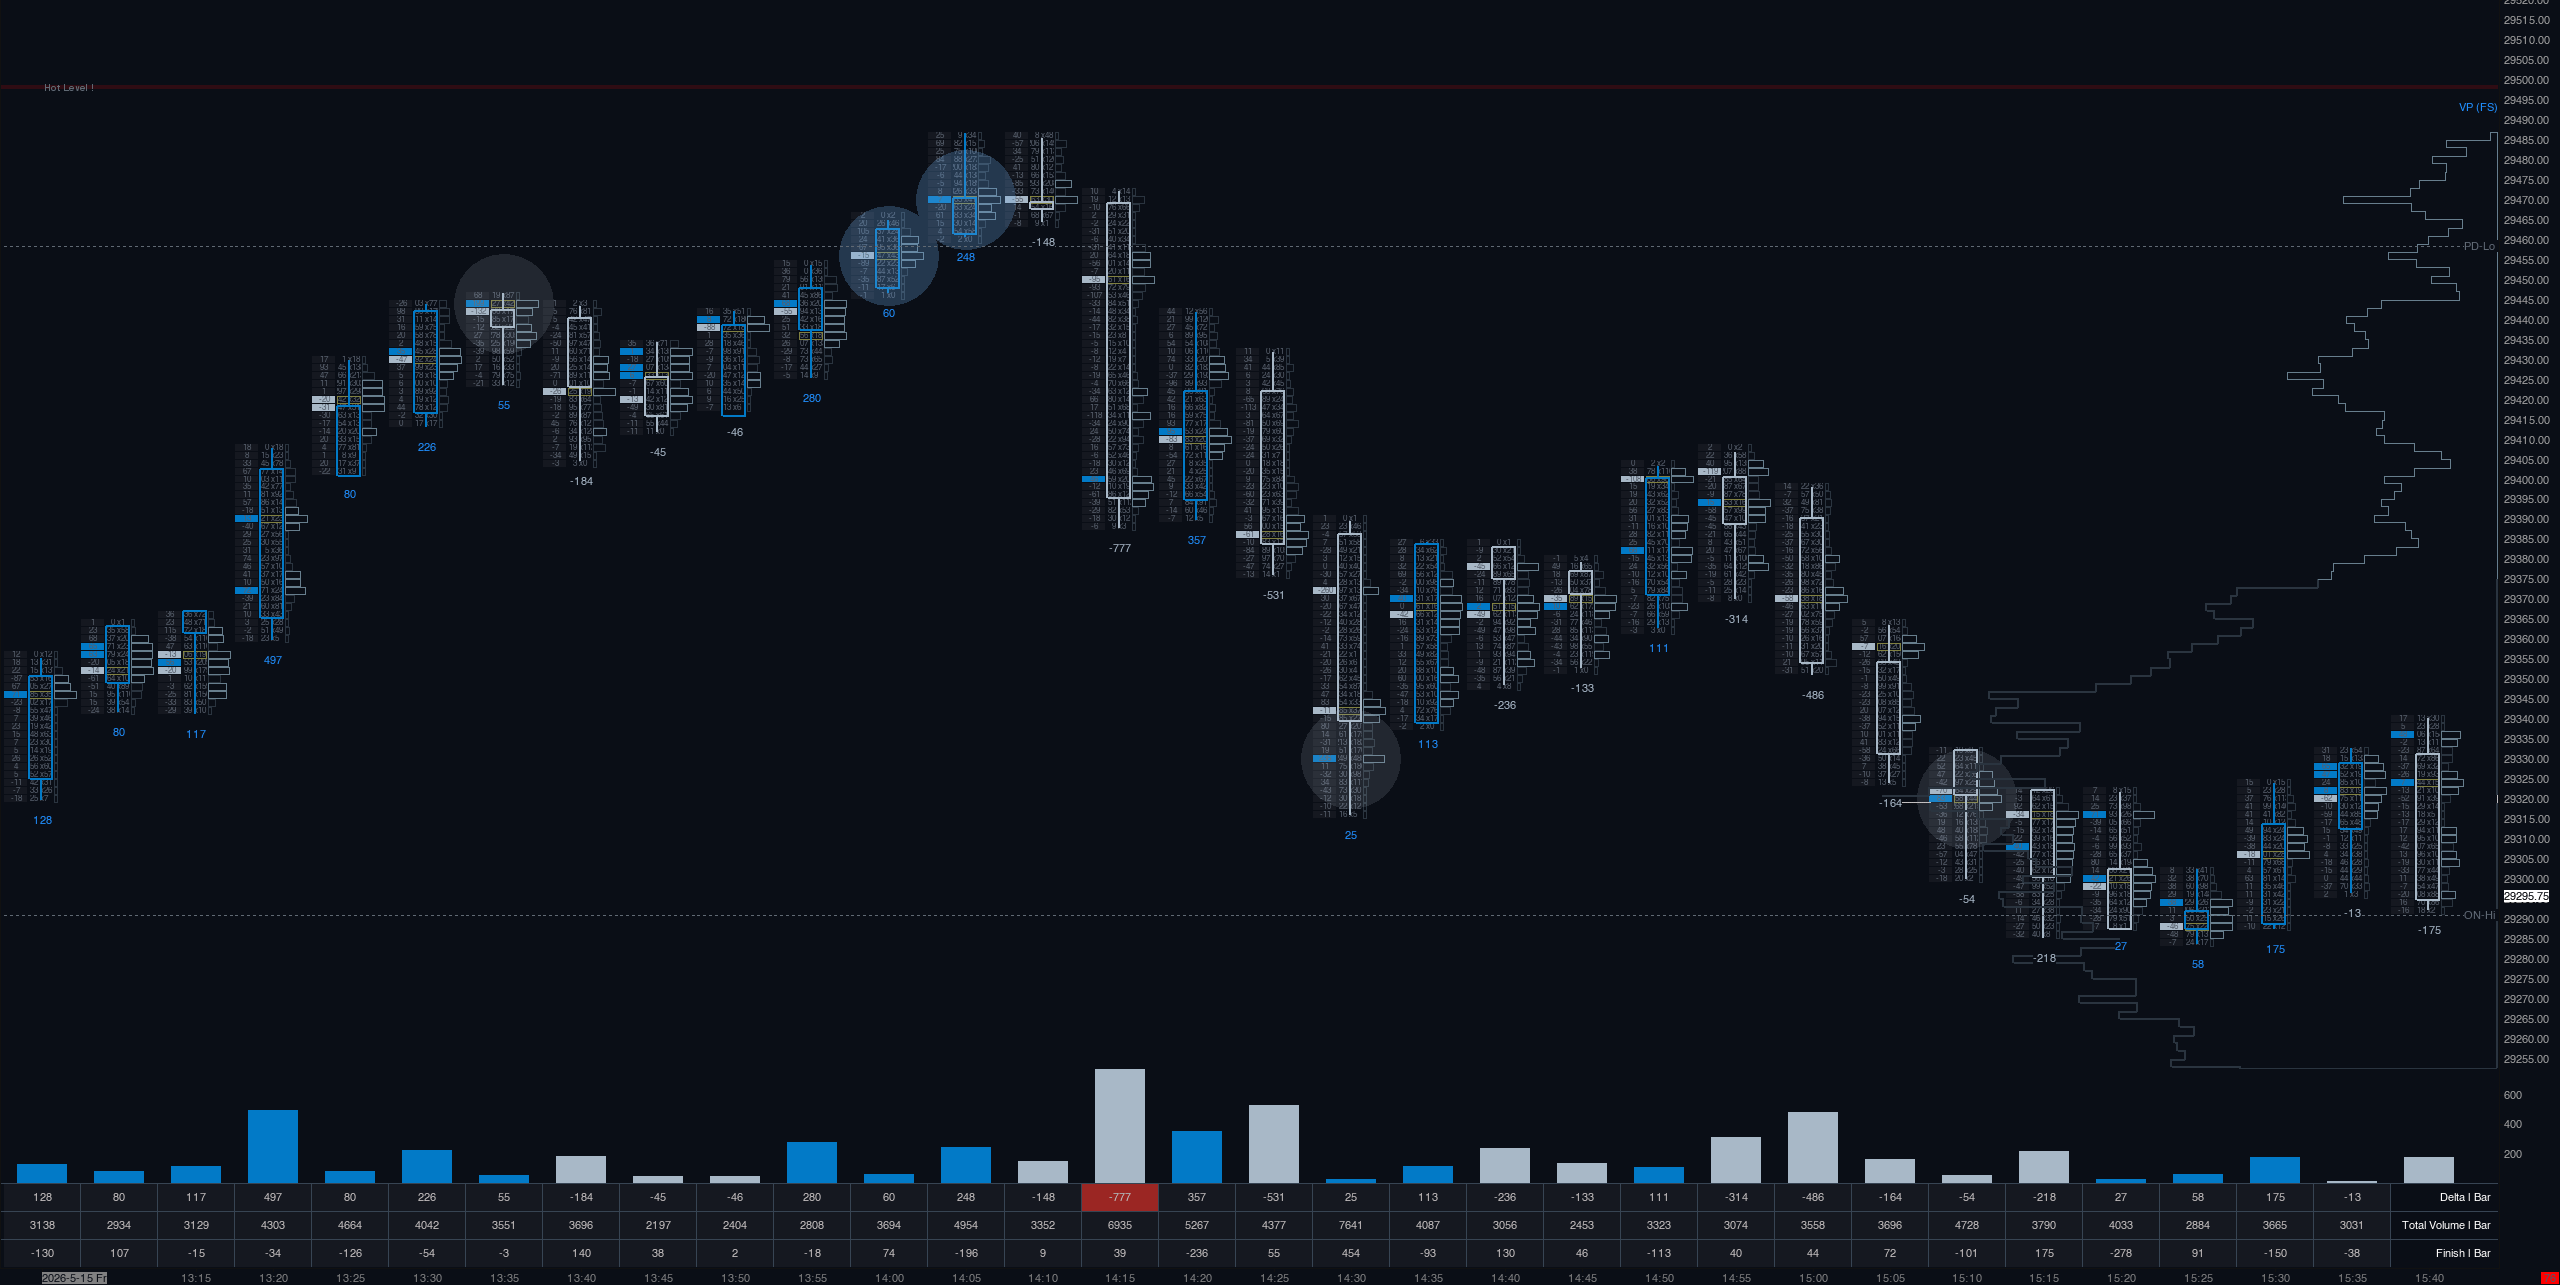
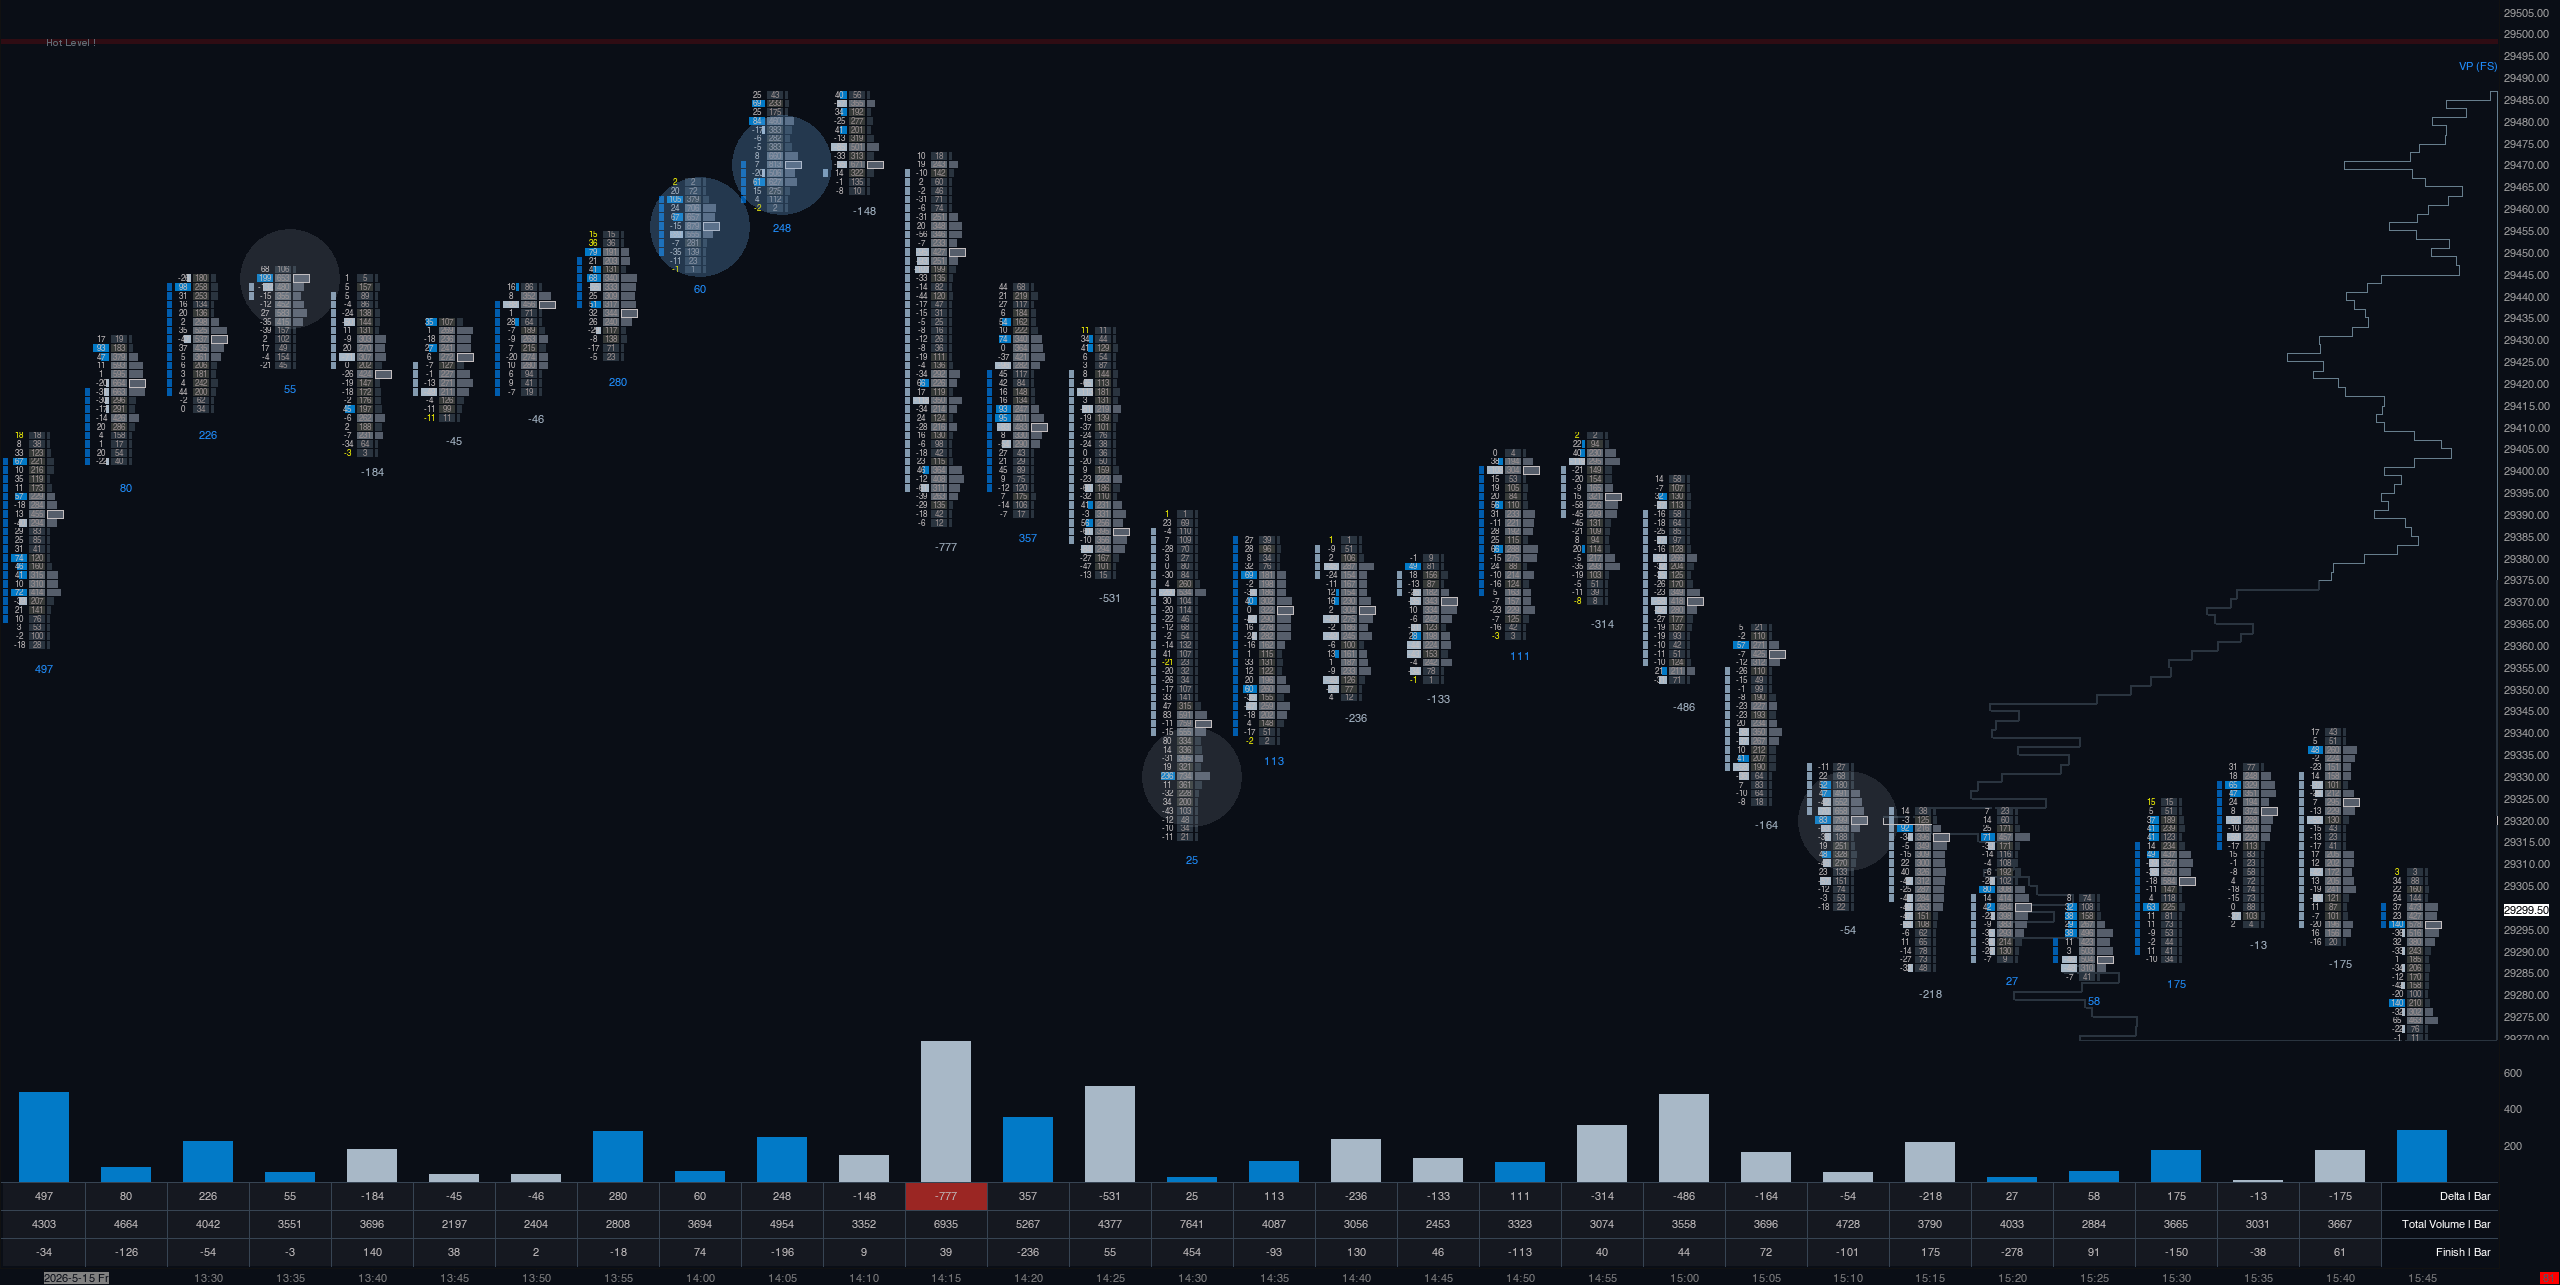
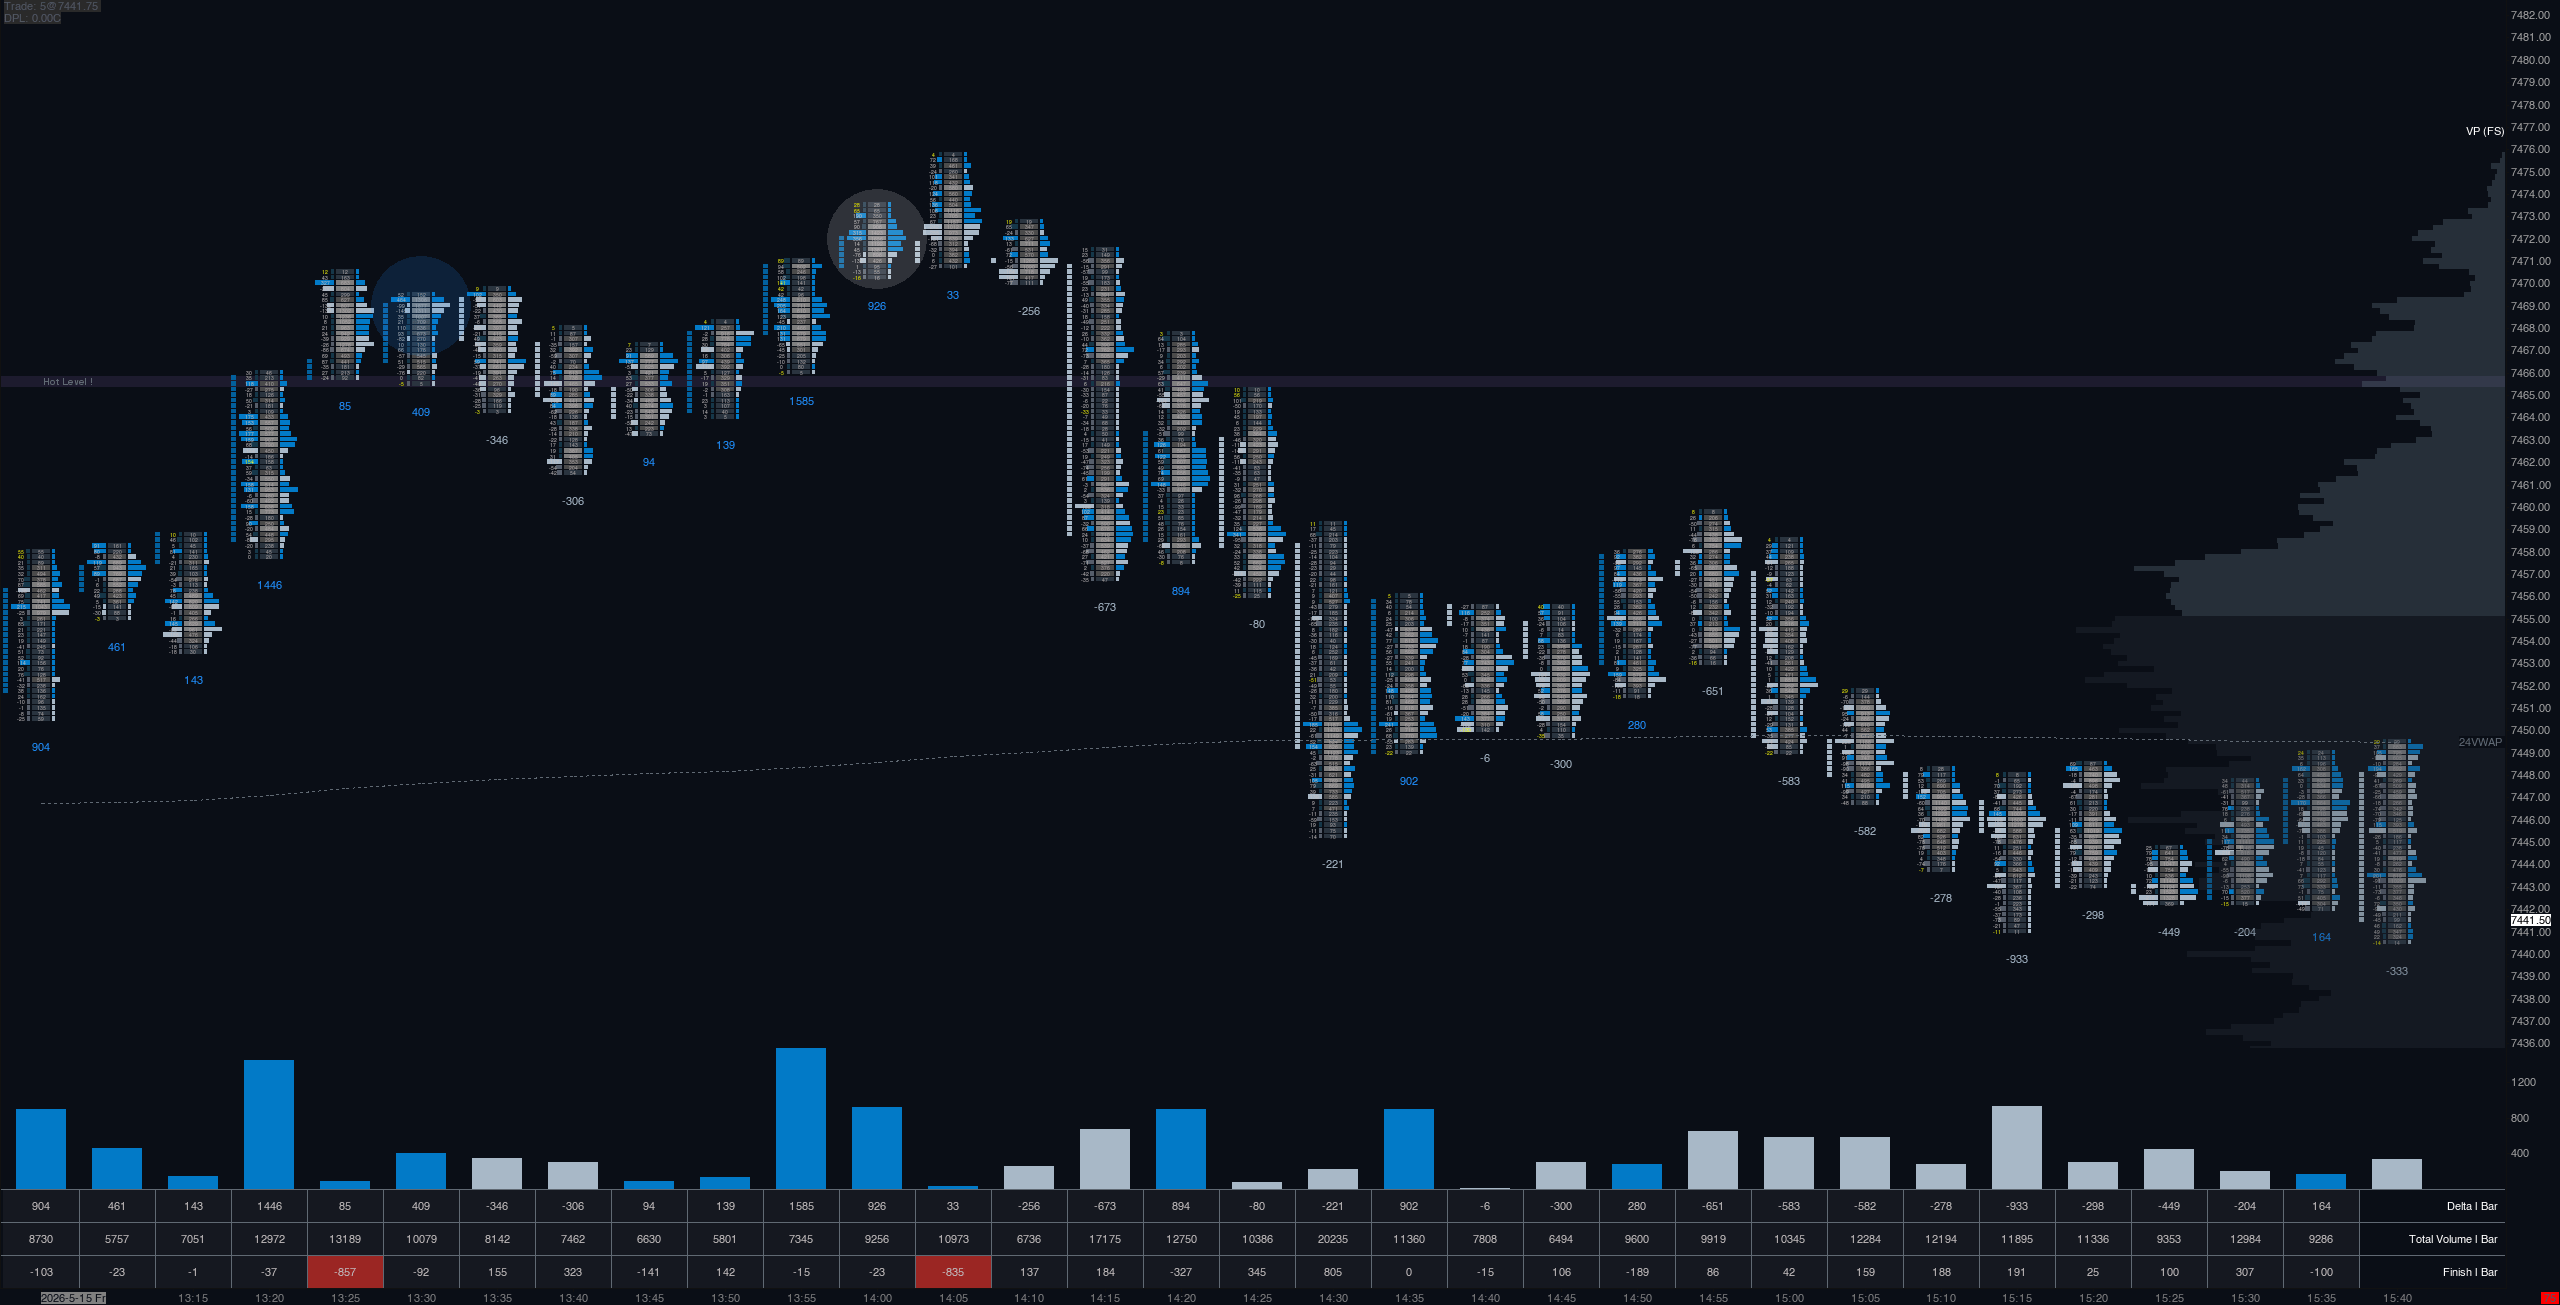

Stop trading with half the story. While standard charts show you where the price moved, this Delta Footprint chart shows you the battle happening inside every candle. It reveals exactly who is in control—the buyers or the sellers—at every single price level.
🟢 Live Order Flow: See the real-time difference between aggressive buying and selling at every tick.
🟢 Identify Traps: Spot "trapped" traders and exhaustion points before they turn into major market reversals.
🟢 Clean Layout: Fully configured for Sierra Chart to keep your workspace clear and easy to read.
🟢 High Performance: Designed to render quickly so you stay ahead of the market without any lag.
🤔 Why Use It?
Standard price action is lagging. By the time a candle closes, the move is often already over. A Footprint chart helps you see the "footprints" of big institutional orders. By watching how buyers and sellers fight for control within each bar, you can stop guessing the direction of the market and start trading with the true flow of money. Get the edge you need to trade with confidence.
3 TYPES OF FOOTPRINT