Incident Trend Analysis Dashboard
The Incident Trend Analysis Dashboard is a powerful, easy-to-use safety management tool designed for organizations to track, analyze, and reduce workplace incidents. With real-time insights on critical safety KPIs such as LTIFR (Lost Time Injury Frequency Rate), Severity Rate, Incident Distribution, and Manhours, this dashboard empowers safety officers, managers, and executives to make data-driven decisions that enhance workplace safety and compliance.
🔑 Key Features
- Comprehensive Metrics
- Total Manhours & Safe Manhours
- LTIFR & Severity Rate
- Total Incidents & Man Days Lost
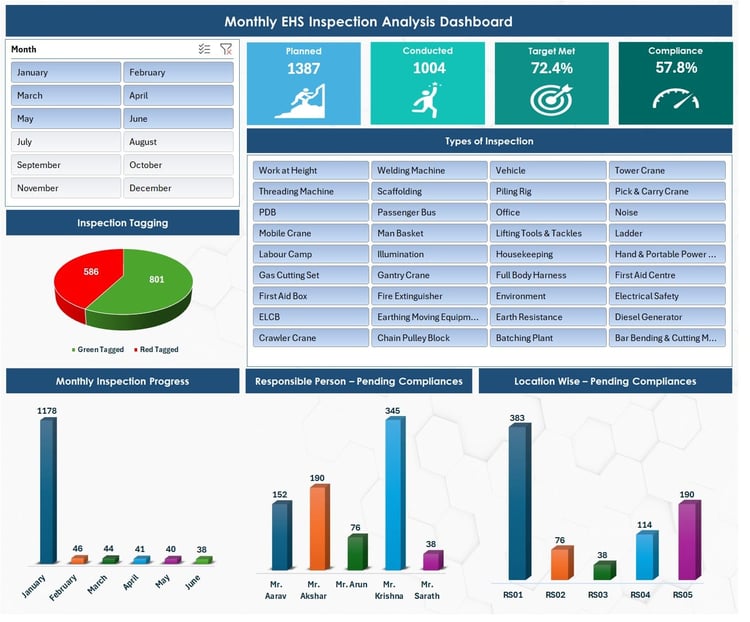
Visual Insights
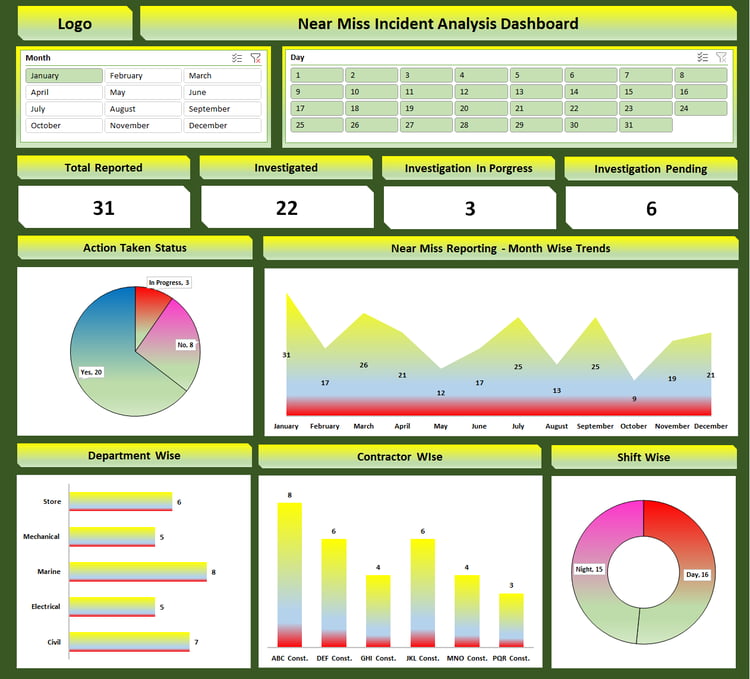
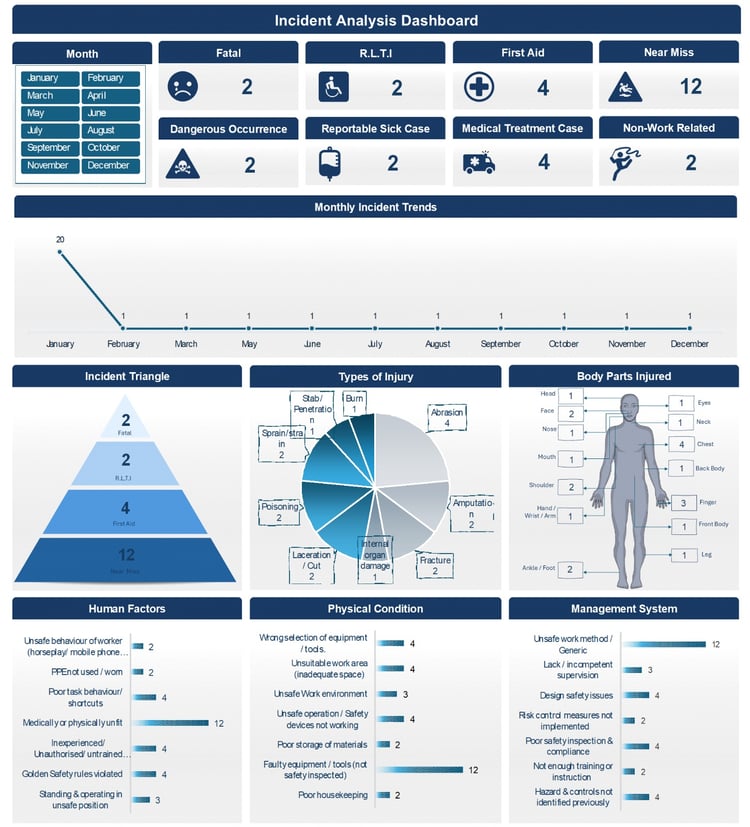
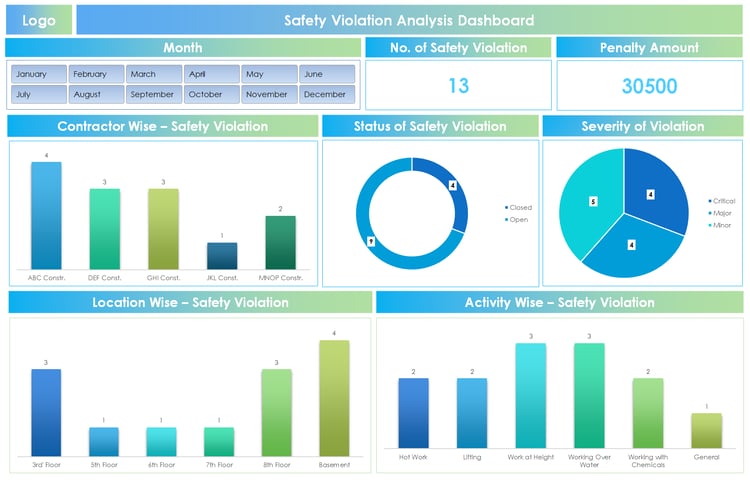
- Incident Distribution Pie Chart – Quickly understand the types of incidents (Fatal, First Aid, Near Miss, Dangerous Occurrence, Lost Time Injury).
- LTIFR Trend Line Chart – Monitor incident frequency trends month by month.
- Severity Rate Area Chart – Track the severity of incidents over time.
Interactive Filters
- Monthly filters allow users to analyze specific time periods for targeted insights.
- User-Friendly Design
- Clean, professional layout with at-a-glance KPI cards.
- Easy navigation for safety teams, managers, and stakeholders.
🎯 Benefits
✔ Proactively identify and address high-risk areas.
✔ Reduce incident rates and improve workplace safety culture.
✔ Enhance compliance with safety regulations and reporting requirements.
✔ Save time with automated analysis and ready-to-present visuals.
👨💼 Ideal For
- Safety Officers & EHS Managers
- HR & Compliance Teams
- Construction, Manufacturing, and Industrial Companies
- Corporate Safety Reporting & Audits
📦 Deliverables
- Fully functional Excel Dashboard (customizable for your company).
- Pre-built templates with formulas and charts.
- Easy-to-update data entry fields.
⚡ Take control of workplace safety with real-time insights. Invest in the Incident Trend Analysis Dashboard today and transform your safety performance!