
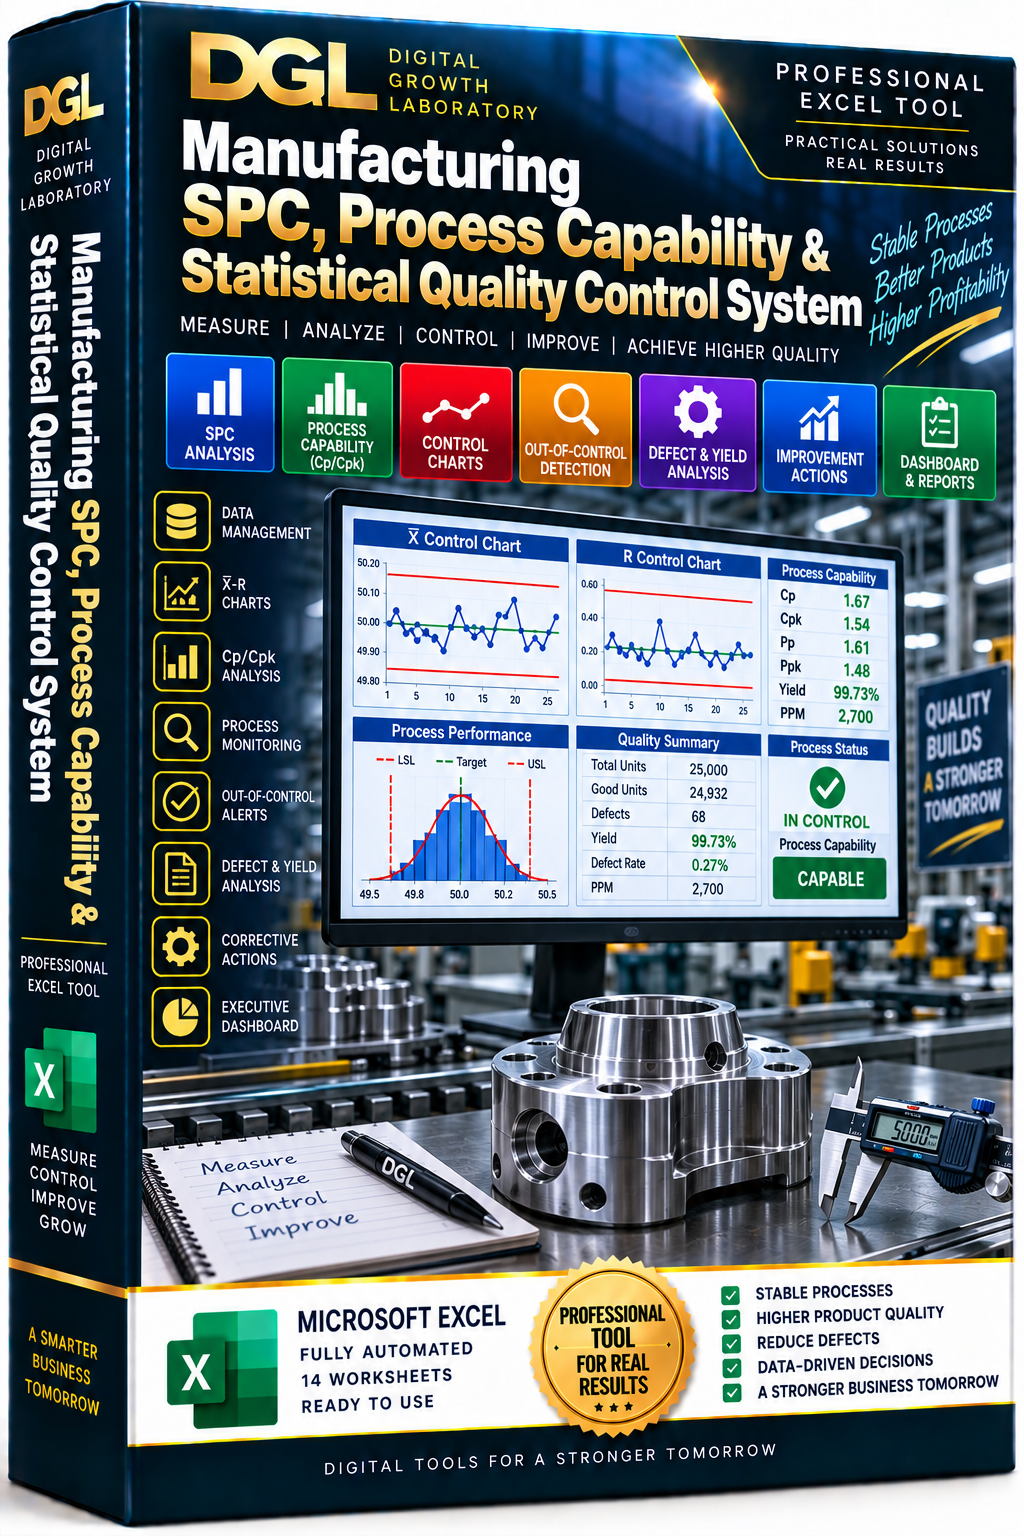
DGL Manufacturing SPC, Process Capability & Statistical Quality Control System — Professional Excel Tool
Monitor manufacturing variation, detect unstable processes and measure true process capability with one professional Excel-based Statistical Process Control system.
The DGL Manufacturing SPC, Process Capability & Statistical Quality Control System is designed for manufacturing companies, quality engineers, process engineers, production managers, Six Sigma professionals and operations teams that need clear statistical visibility into process stability, capability and product quality.
The system connects the complete statistical quality workflow:
MEASUREMENT DATA → SUBGROUP ANALYSIS → X-BAR CONTROL → RANGE CONTROL → PROCESS VARIATION → Cp / Cpk → Pp / Ppk → OUT-OF-CONTROL SIGNALS → DEFECT & YIELD ANALYSIS → IMPROVEMENT ACTIONS → EXECUTIVE DASHBOARD
PROCESS & QUALITY CHARACTERISTICS REGISTER
Create a structured register of the manufacturing processes and characteristics that require statistical monitoring.
Track:
• Process ID
• Product / Product Family
• Process Name
• Department
• Production Area / Line
• Quality Characteristic
• Characteristic Type
• Measurement Unit
• Lower Specification Limit — LSL
• Target / Nominal Value
• Upper Specification Limit — USL
• Subgroup Size
• Sampling Frequency
• Measurement Method / Gauge
• Process Owner
• Process Status
PRODUCTION MEASUREMENT DATA
Maintain traceable manufacturing measurement records.
Track:
• Measurement ID
• Process
• Date
• Shift
• Batch / Lot
• Subgroup
• Sample Number
• Measurement Value
• Operator / Inspector
• Gauge
• Machine / Production Line
• Result Against Specification
• Deviation From Target
• Automatic In-Spec / Out-of-Spec Status
SUBGROUP STATISTICAL ANALYSIS
Automatically calculate key statistical values for each production subgroup.
The system calculates:
• Subgroup Mean
• Minimum
• Maximum
• Range
• Standard Deviation
• Process Center Line
• Average Range
• Upper Control Limit
• Lower Control Limit
• Automatic Statistical Control Status
X-BAR CONTROL CHART
Monitor changes in the center of the manufacturing process.
The automated X-bar chart helps identify:
• Process Mean Shifts
• Unexpected Process Movement
• Special-Cause Variation
• Measurements Outside Statistical Control Limits
• Developing Process Instability
RANGE CONTROL CHART
Monitor variation inside production subgroups.
The R chart helps identify:
• Increasing Process Variation
• Unstable Equipment
• Tool Wear
• Setup Variation
• Measurement Problems
• Unexpected Process Changes
PROCESS CAPABILITY ANALYSIS
Determine whether a manufacturing process is capable of consistently producing within specification.
Automatically calculate:
• Process Mean
• Within-Subgroup Variation
• Overall Variation
• Cp
• Cpk
• Pp
• Ppk
• Estimated Defect PPM
• Yield %
• Automatic Capability Status
• Automatic Performance Status
Cp measures potential process capability.
Cpk measures actual capability while accounting for process centering.
Pp evaluates overall process performance.
Ppk evaluates actual long-term performance against specification limits.
AUTOMATIC CAPABILITY CLASSIFICATION
The system automatically evaluates process capability against defined management thresholds.
Possible classifications include:
• EXCELLENT
• CAPABLE
• MARGINAL
• NOT CAPABLE
This gives managers and engineers immediate visibility into processes that require improvement.
OUT-OF-CONTROL SIGNAL DETECTION
Automatically identify statistical signals that indicate potential special-cause variation.
Monitor:
• X-bar Above UCL
• X-bar Below LCL
• Range Above UCL
• Statistical Signal Status
• Signal Severity
• Responsible Owner
• Required Investigation
• Action Status
DEFECT, YIELD & QUALITY LOSS ANALYSIS
Connect statistical process performance with actual production quality.
Track:
• Units Produced
• Units Inspected
• Defects
• Scrap
• Rework
• Automatic Yield %
• Automatic Defect Rate %
• Automatic Defect PPM
• Primary Defect Type
• Batch / Lot
• Process
CORRECTIVE & CONTINUOUS IMPROVEMENT ACTIONS
Convert SPC signals and capability gaps into controlled improvement activities.
Track:
• Process
• Statistical Trigger
• Problem
• Root Cause
• Corrective / Improvement Action
• Responsible Owner
• Priority
• Start Date
• Due Date
• Status
• Completion Date
• Verification
• Automatic Days to Due
• Automatic Overdue Alert
• Effectiveness
SPC & PROCESS CAPABILITY MANAGEMENT ANALYSIS
Automatically monitor:
• Subgroups Monitored
• Out-of-Control Subgroups
• Current Cpk
• Current Ppk
• Estimated Defect PPM
• Production Yield
• Open Improvement Actions
• Overdue Improvement Actions
EXECUTIVE MANAGEMENT DASHBOARD
The automated dashboard provides immediate visibility into:
• Total Subgroups Monitored
• Out-of-Control Conditions
• Cpk
• Ppk
• Yield
• Process Mean
• Process Range
• X-bar Control Limits
• R Control Limits
• Statistical Control Status
• Capability Status
• Management Alerts
• Corrective Action Requirements
• SPC Process Stability Trends
The system helps management answer critical questions:
Is the manufacturing process statistically stable?
Is process variation increasing?
Is the process centered correctly?
Can the process consistently meet specification limits?
What are the current Cp and Cpk values?
What are the long-term Pp and Ppk values?
Which production subgroups are outside statistical control?
Where are special causes of variation appearing?
What is the estimated defect exposure in PPM?
What percentage of inspected production meets requirements?
Which processes require corrective action?
Are improvement actions being completed on time?
Is process capability improving or deteriorating?
WORKBOOK INCLUDES
• 14 Connected Worksheets
• Process & Quality Characteristics Register
• Production Measurement Database
• Automated Subgroup Statistics
• Automated X-Bar Control Chart
• Automated R Control Chart
• Control Limit Calculations
• Process Variation Analysis
• Cp Calculation
• Cpk Calculation
• Pp Calculation
• Ppk Calculation
• Automatic Capability Classification
• Automatic Out-of-Control Signal Detection
• Defect & Yield Analysis
• PPM Analysis
• Corrective & Improvement Action Management
• SPC Management Analysis
• Executive Management Dashboard
• Automated Formulas
• Automated Alerts
• Example Manufacturing Data
• Built-In Instructions
• Ready-to-Use Professional Structure
DIGITAL PRODUCT:
Microsoft Excel (.xlsx)
PRODUCT LINE:
DGL Professional Tools
BRAND:
Digital Growth Laboratory
IMPORTANT:
This workbook is a statistical process control and manufacturing quality management support tool. It does not provide professional certification or guarantee compliance with ISO 9001, IATF 16949, AS9100, Six Sigma, AIAG or other customer, regulatory or industry-specific requirements. Statistical methods, sampling plans, control limits, capability targets and acceptance criteria should be reviewed and validated by qualified personnel for the specific manufacturing process.