
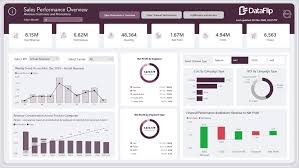
Power BI dashboard templates have become valuable tools for businesses that want to simplify data analysis and reporting. Power BI templates provide structured frameworks that help organisations transform raw business information into interactive reports and visual dashboards. By using a suitable template, companies can reduce repetitive reporting work, improve consistency, and make important information easier to understand.
What Are Power BI Dashboard Templates and Power BI Templates?
Power BI dashboard templates are pre-designed reporting frameworks that can include charts, graphs, tables, KPI cards, filters, and other visual components. They provide users with a starting point for developing dashboards without having to design every element from the beginning.
Power BI templates can be adapted for different business functions, including sales, marketing, finance, human resources, operations, supply chain, and customer service. Businesses can customise the structure according to their specific reporting requirements.
Benefits of Power BI Dashboard Templates
One of the biggest advantages of power bi dashboard templates is the time they can save. Creating a professional dashboard from scratch may require considerable effort, especially when multiple departments need regular reports. Templates provide an existing structure that users can modify rather than starting with a blank report.
Another advantage is reporting consistency. When different teams use similar dashboard structures and KPI definitions, management can compare performance more easily.
Customising Power BI Templates
Every organisation has different objectives, so Power BI templates should be customised according to business needs. Users can modify visualisations, filters, calculations, data connections, and KPI indicators.
For example, a sales department may require revenue, order volume, conversion rates, and customer performance. A finance department may focus on expenses, profitability, budgets, and cash flow.
Power BI Dashboard Templates for Data Analysis
Power BI dashboard templates can make large volumes of information easier to analyse. Interactive visualisations allow users to filter information by product, region, department, customer, or time period.
Instead of reviewing lengthy spreadsheets, managers can use dashboards to identify important trends and compare performance quickly.
Importance of Reliable Data
A dashboard is only as useful as the information behind it. Businesses should ensure that data sources are accurate, properly connected, and regularly updated.
Before using Power BI templates, organisations should review data relationships, calculations, refresh schedules, and access permissions. Good data management can improve confidence in dashboard results.
Improving Business Decision-Making
Well-designed dashboards can help decision-makers focus on relevant performance indicators. By presenting information visually, power bi dashboard templates can make it easier to identify opportunities, recognise potential problems, and monitor progress towards business goals.
However, dashboards should focus on meaningful metrics rather than including excessive information.
Conclusion
Power BI dashboard templates provide businesses with a practical starting point for creating interactive and professional reports. Power BI templates can reduce repetitive development work, improve reporting consistency, and support better data analysis. By selecting suitable templates, customising relevant KPIs, and maintaining reliable data, organisations can create dashboards that turn complex information into useful business insights.