
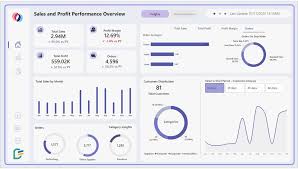
Businesses need more than basic sales reports to understand whether their operations are generating sustainable returns. A sale and profit power bi dashboard template can help organizations monitor revenue, profitability, sales trends, and product performance in one interactive view. Using power bi dashboard templates allows teams to organize complex business information and transform raw sales data into useful insights for better decision-making.
Understanding Sales and Profit Performance
Sales volume alone does not always indicate business success. A company may generate strong revenue while experiencing low profit because of high costs, discounts, or inefficient operations. A sale and profit power bi dashboard template helps users compare sales revenue with profit margins and identify products, customers, and regions contributing most effectively to business performance.
With interactive visualizations, managers can examine monthly sales, profit percentages, product categories, customer segments, and regional performance. Filters allow users to focus on specific periods or business segments without creating multiple reports. This makes it easier to understand where revenue is growing and where profitability needs attention.
Benefits of Power BI Dashboard Templates
Modern power bi dashboard templates provide a structured foundation for presenting business information. Instead of manually preparing spreadsheets and repeatedly updating charts, teams can connect relevant datasets and use organized dashboard structures to display important metrics.
These templates can include charts, KPI cards, tables, trend lines, and comparison visuals. Businesses can customize dashboards according to their reporting requirements. Sales managers can focus on revenue and targets, while finance teams may prioritize profit margins, expenses, and profitability trends.
Tracking Revenue and Profit Margins
A sale and profit power bi dashboard template can help users examine the relationship between sales revenue and profitability. Monitoring both metrics together is important because increasing sales do not necessarily mean increasing profits.
For example, a business may experience higher sales because of heavy discounts while its profit margin continues to decline. A dashboard can make such changes easier to identify. Managers can then review pricing, product costs, promotional strategies, and sales channels to determine what is affecting profitability.
Improving Business Decisions
A sale and profit power bi dashboard template can help businesses identify sales opportunities and potential performance issues. For example, declining profit despite increasing sales may indicate rising costs or excessive discounting. Managers can investigate these patterns and take corrective action before they significantly affect overall performance.
Interactive reporting also improves communication between departments. Sales, finance, marketing, and management teams can work from consistent information rather than relying on separate spreadsheets. This shared visibility can make meetings more productive and help teams focus on measurable business goals.
Customizing Power BI Dashboard Templates
One advantage of power bi dashboard templates is their flexibility. Businesses can adapt dashboards to display the metrics most relevant to their operations. A retail company may track product-level sales and regional profit, while a service company may focus on customer revenue, project profitability, and monthly performance.
Dashboards can also be updated as reporting requirements change. Additional data sources, filters, KPIs, and visualizations can be incorporated to provide a more complete view of business performance.
Conclusion
Data-driven decision-making is increasingly important for competitive businesses. A sale and profit power bi dashboard template provides a practical way to monitor financial and sales performance while making complex information easier to understand. By using power bi dashboard templates, organizations can simplify reporting, identify trends, compare performance, monitor profitability, and develop stronger strategies based on reliable business information.