
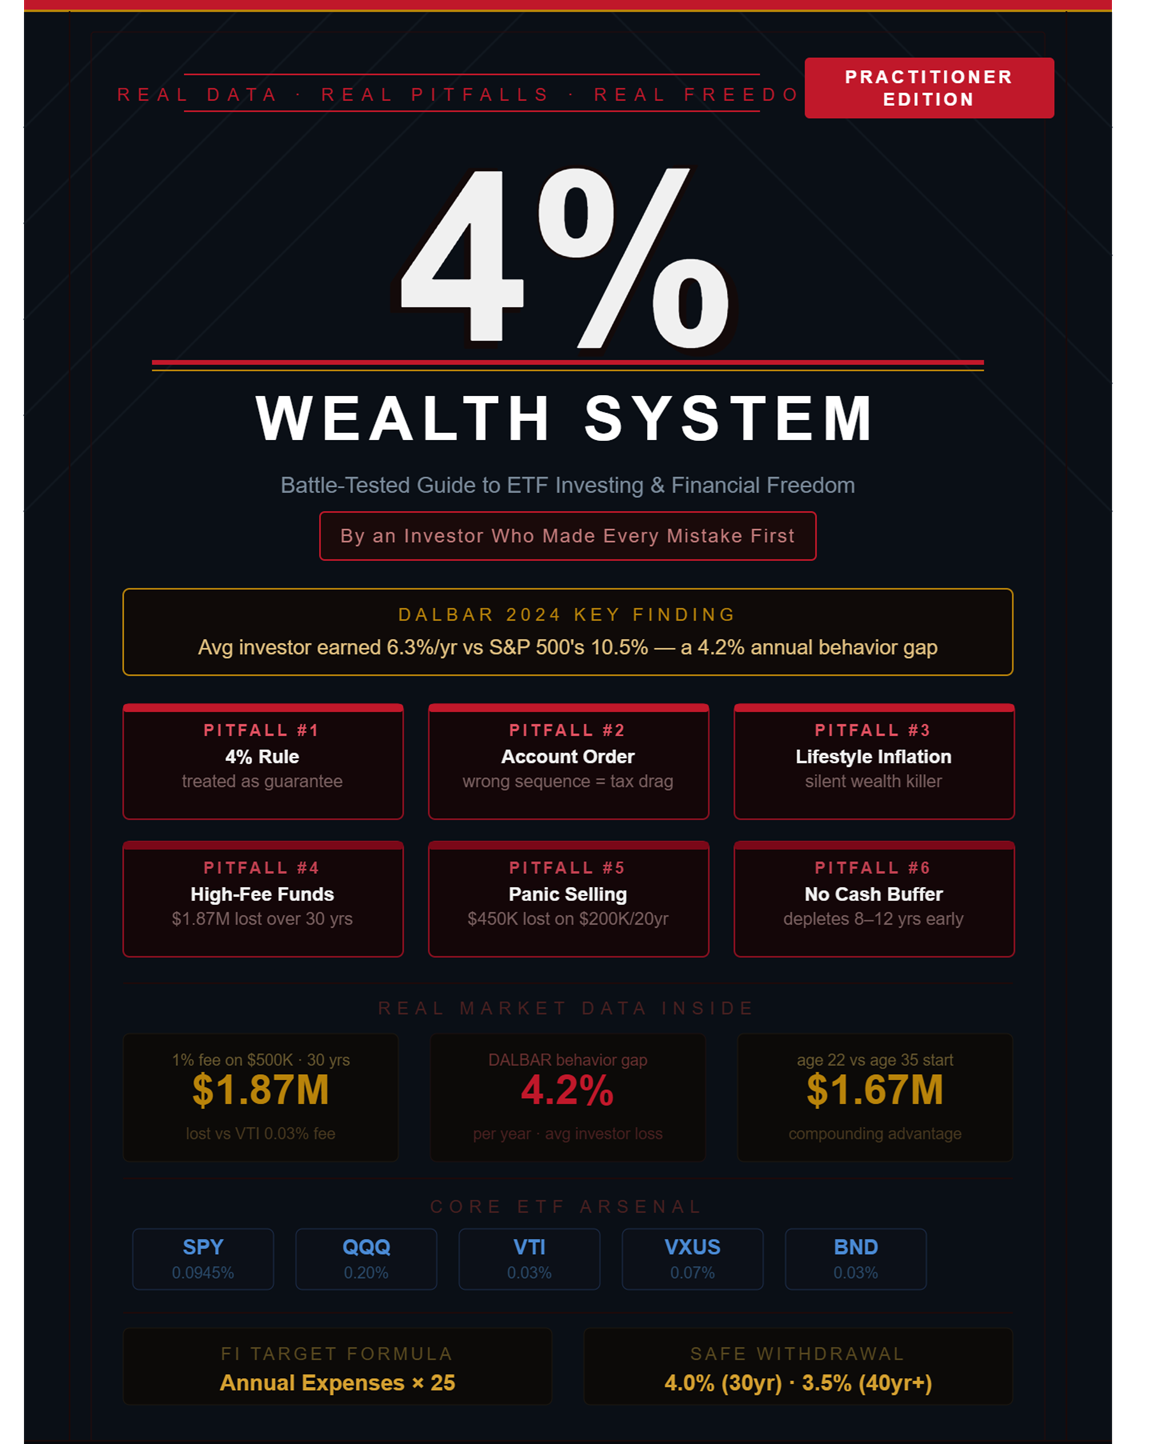
Most People Understand the 4% Rule. Almost Nobody Executes It Correctly.
Ebook : 4% Wealth System
The 4% Rule — withdraw 4% of your portfolio annually, and historical data says you will never run out of money — is one of the most well-known concepts in personal finance. It is also one of the most misapplied. The theory is solid. The execution failures are costly, specific, and entirely avoidable.
This guide cuts through the motivational language and gives you what actually matters: the real market data behind the strategy, and the hard-learned pitfalls that derail investors who know the theory but fail in practice.
The 4% Rule has a 95%+ historical success rate over 30-year periods. It also has documented failure scenarios. Knowing both — and building your system around the failure modes — is what separates investors who achieve financial freedom from those who merely understand it.
What the Data Actually Shows
The original 1994 Bengen study and the 1998 Trinity Study are robust. But the headlines miss three critical nuances:
- The 4% Rule was validated for 30-year retirements. If you retire at 40 and live to 90, you need a 50-year portfolio — and the research recommends 3.5% as the safer initial withdrawal rate for that horizon.
- Sequence of returns risk is the primary failure mechanism. A portfolio that loses 30% in year one of retirement, then earns average returns, performs dramatically worse than a portfolio that earns average returns throughout — even with the same long-run average. The first five years are the most vulnerable.
- The rule requires a primarily equity-heavy portfolio. A 4% withdrawal from a conservative 40/60 (stock/bond) portfolio has significantly higher failure rates than the same withdrawal from a 70/30 or 80/20 portfolio.
SPY, QQQ, VTI: The Real Performance Numbers
Three ETFs form the backbone of most evidence-based financial independence portfolios. Here is what the 20-year data actually shows:
- VTI (Vanguard Total Market) — 20-year average: ~9.9% annually. Expense ratio: 0.03%. Holds 3,600+ U.S. stocks. Maximum diversification at minimum cost. The optimal core holding for most investors.
- SPY (S&P 500) — 20-year average: ~9.8% annually. Expense ratio: 0.0945%. Virtually identical to VTI in long-run performance. Higher liquidity and longer track record.
- QQQ (Nasdaq-100) — 20-year average: ~15.2% annually. Expense ratio: 0.20%. Exceptional returns — but 60%+ technology concentration, and a history of 83% peak-to-trough crashes (2000–2002). Powerful as a 20–30% portfolio allocation, dangerous as a standalone holding.
PITFALL: Fee erosion is catastrophic in compounding terms. A 1.0% annual fee on a $500,000 portfolio costs $1.87 million in lost compounding over 30 years versus VTI's 0.03% fee. The gap is not the fee — the gap is 30 years of compounding on what you paid.
The Behavior Gap: Why Most Investors Underperform Their Own Funds
The 2024 DALBAR Quantitative Analysis of Investor Behavior found that the average equity fund investor earned 6.3% annually over the past 20 years, while the S&P 500 returned 10.5%. The 4.2% annual gap is not caused by bad fund selection — it is caused by emotional decision-making.
On a $200,000 portfolio over 20 years, that behavior gap costs approximately $450,000 in final portfolio value. This is not a rounding error — it is the difference between financial independence and continued dependence on a paycheck.
The five behavioral traps that drive this gap: panic selling during corrections, chasing last year's top performer, interrupting dividend reinvestment, ignoring account tax structure, and over-monitoring leading to reactive trading. Every one of these is eliminated by automation.
Solution: Automate every step — paycheck transfer, ETF purchase, dividend reinvestment, annual rebalancing. Automation does not just save time. It removes your behavioral self from the investment equation entirely — which the data shows is the single highest-return action available to most investors.
The Action Plan: Build the System Today
The complete framework in order of priority:
- Max your 401(k) employer match first — it is a guaranteed 50%–100% return before the market does anything.
- Fund your Roth IRA ($7,000/yr, 2025) — tax-free growth compounds to ~$925,000 over 30 years on a $7K annual contribution at 9%.
- Build your ETF core: 50% VTI + 30% QQQ + 20% VXUS as a starting allocation. Add BND as you approach your FI target.
- Calculate your FI number: Annual expenses × 25. Add 15% for healthcare and surprise costs. Build a 2-year cash buffer before the withdrawal phase.
- Stay invested through every correction. The 34% COVID crash of 2020 fully recovered in 5 months. The investors who sold locked in permanent losses on the fastest recovery in market history.
The math of financial freedom is not complicated. The behavior required to let the math work is. Build the system today — and then get out of its way.
Start the system. Avoid the traps. Let the compound curve do its work.