

My school has some pretty neat things happening in it. Teachers are putting in tons of extra time to create special memories for students.
Every once in a while, their ideas include me as I can provide some technological solutions. The latest was "Dancing With The Teachers" which was great fun for the teachers and students, but nerve-wracking for me. I was asked to create a way to collect audience scores, mix them with the judging scores, and then produce a ranked list to announce the winner at the end of the event, instead of at the end of the day, which would be anticlimactic.
How did I pull this one off? Google Forms and Spreadsheets by just using formulas. Why not those fancy scripts I've been developing? I needed it to work automatically and scripts can be a little flaky at high volume.
Here is a link to the sample spreadsheet. This is how I made it...
Create a Spreadsheet and then attached the Google Forms
All of the forms were created within one spreadsheet so the data could be combined without an "=importrange" function as these can error out.
- Create a spreadsheet, change the default sheet's name to "Data".
- Go to "Tools - Create a new form".
- In the new form, enter in the group's name as the title, and add a "Linear Scale" question with the default 1-5 rating and then "Below expectation" and "Above expectation" as the descriptors. Feel free to add in any visual pieces (i.e. themes and pix) but the users will not spend much time in it so I left my extremely basic...I also did not have much time or energy to make it "pretty".
- Head back to the spreadsheet and find the newly created response sheet and call it the group name. In my case, "Group A".
- Repeat this process for all contestants, renaming each response form (e.g., Groups A, B, and C).
Gather up the links
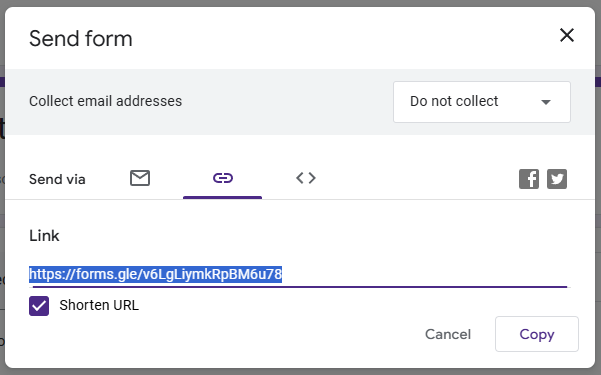
In the Data sheet, create a chart with the group names and the shortened Form links. Click the "Send" button on the form, click the "chain link" icon, check "shorten," and copy the link.
(I actually cheated a little and used my "Locked Form" template to quickly make all the forms and link them to the page!).
Make The QR Codes
Since the audience is voting, create a QR code for each of the forms using the shortened version of the link and place into a slideshow for the audience.
Collecting the Voting Information
Create a new sheet called "Voting" to collect all the voting data. In cell A2, type this:
=sort(arrayformula({'Group A'!A:C;'Group B'!A:C;'Group C'!A:C}))
- The {}s let you select different data groupings and combine them into one so all the voting data is combined. The ";" ensure that each form's data is in rows instead of columns.
- It is extremely important to use the range starting at the first row (i.e. A:C) or every form submission will push down the formula reference and it will remain blank (i.e. A2:C becomes A3:C on the first submission and it keeps increasing which causes it to return blank rows.).
- "Arrayformula" is a great formula as it allows all the data to be transferred to the new page.
- Sort makes sure all the data is at the top instead of random blank rows.
In the first row, put in your data headings (Timestamp, Rating, and Group for the example).
Pivot!
The couch is optional (only for my "Friends").This is where the magic truly happens.
- Highlight all the data columns in the "Voting" sheet.
- Go to "Insert - Pivot Table".
- Leave the data range alone and click on "Existing Sheet".
- Click on the new "4x4 table" icon.
- Go to the "Data" sheet and select an empty cell/column. (i.e. E2 to allow a title above it) and click "Create"
- In the new window, click on "Add" beside Rows and select "Group".
- Click on "Add" beside Values and select "Rating" and change "Summarize by" to "Count"
- Click on "Add" beside Values and select "Rating" and change "Summarize by" to "Sum"
This pivot table will update when there is a form submit. One warning...Google likes to update by blanking out the screen randomly...just breath and it will come back. It happened three times during the voting and I thought I'd need the AED device the first time.
Calculation Time
- Add headings for the Student Vote, Judges Voting, and Total Points.
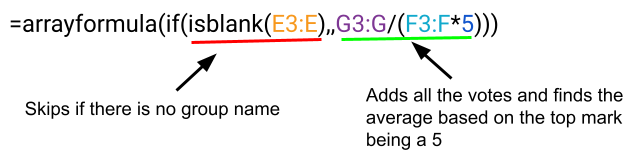
- Under the "Student Voting", I used this:
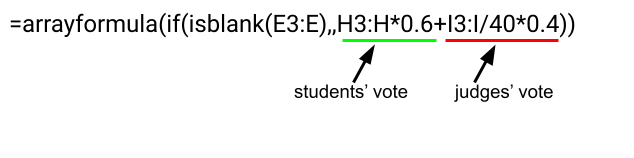
- Add in the judges votes under "Judges Voting" during the event. Our voting had four judges so it had a total of 40 points.
- The judging was to have 60% student votes and 40% judges. Under "Total Points", I used this:
- Add the headings "Rating" and "Group" under the Group/Form Link chart.
- Under Rating, I used: =sort({J4:J,E4:E},1,false) to make a ranked list
At the end of the event, 2876 votes had been cast and this setup performed very well. The winning group was crowned, the dancing teachers hobbled off the stage while the student dancers were ready for more, and I survived another event. Now I have a template for any future voting scenarios! Hopefully, this helps you also.
Please leave a comment if you used this with a project. I would love to know how this is being used.
Comments ()