

Levey-Jennings control charts and Westgard rules
To effectively monitor and interpret quality control (QC) data, it is important to compare the values of each positive control with the established mean and standard deviations of the control sample.
To create the chart used for plotting daily control values, we need the mean value, as well as the values of ±1, 2, and 3 standard deviations (SDs).
To calculate 2 SDs, multiply the SD by 2, and then add and subtract each result from the mean.
To calculate 3 SDs, multiply the SD by 3, and then add and subtract each result from the mean.
For any given data point, approximately 68.3% of values will fall within +1 SD, 95.5% within ±2 SD, and 99.7% within +3 SD of the mean.
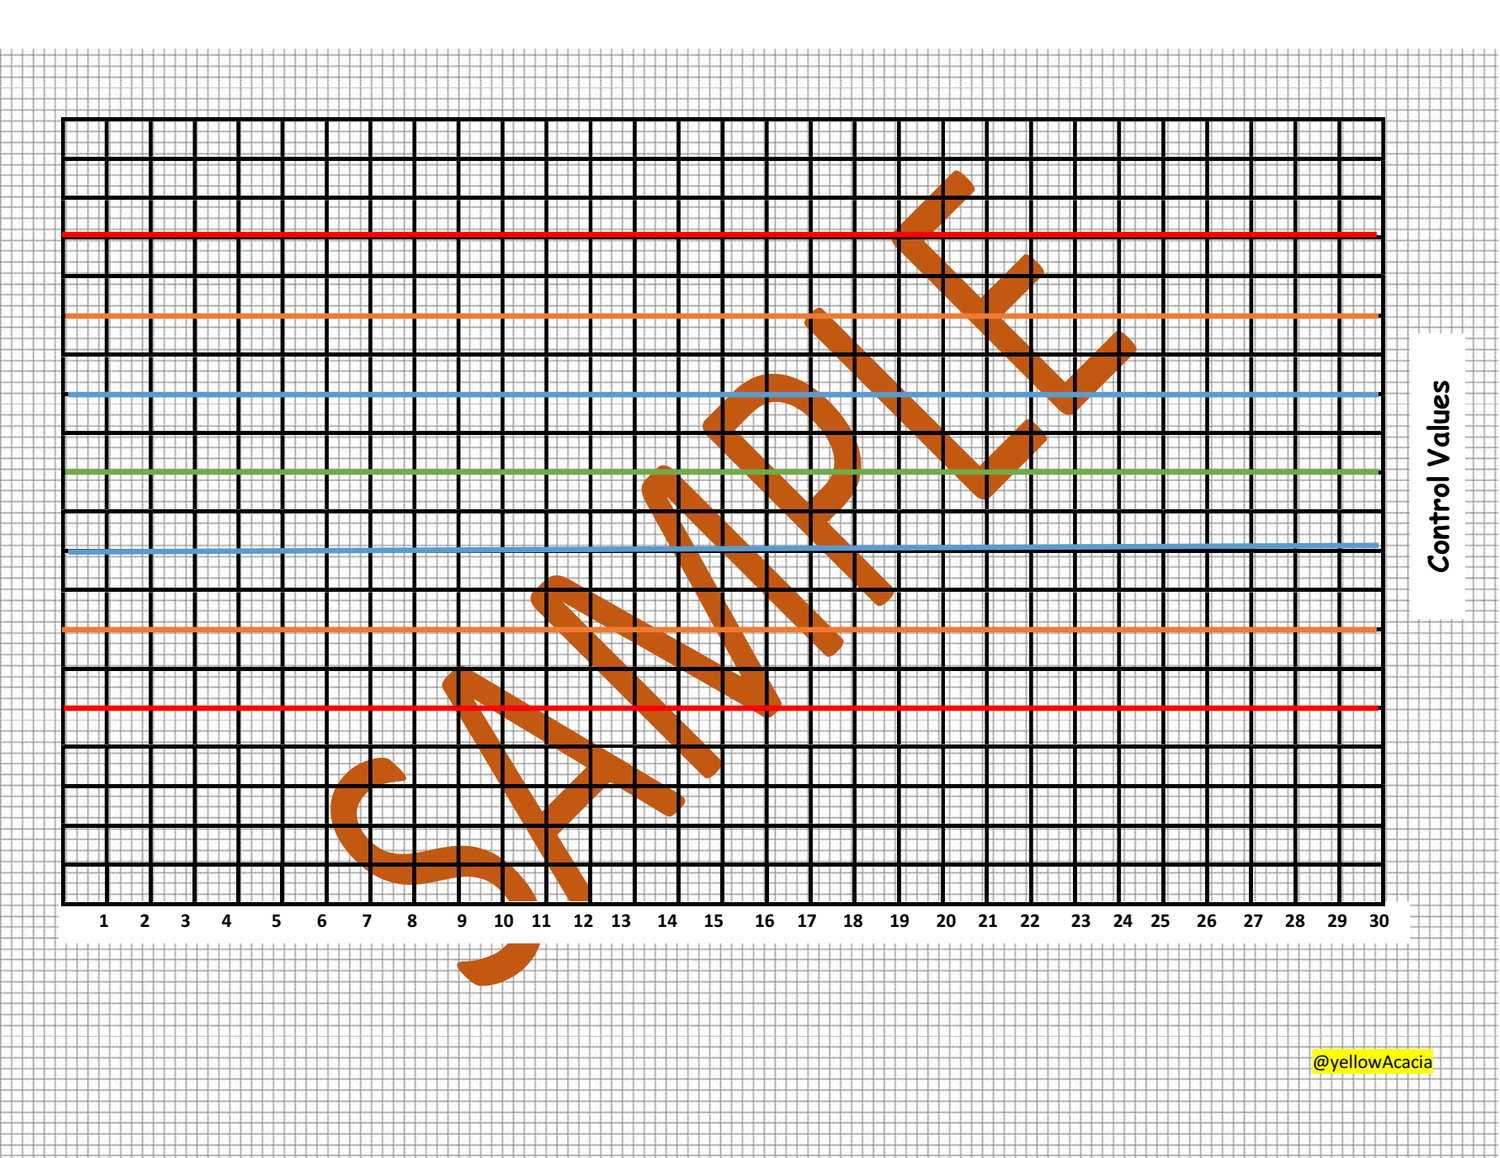
To create Levey–Jennings charts for daily use in the laboratory, the initial step is to calculate the mean and SD using a set of 20 control values. Once the appropriate control value range has been established, it is highly beneficial to represent this range graphically for daily monitoring. Levey–Jennings charts are commonly used for this purpose.
On the chart, the control values are plotted on the Y-axis, while the date/time is plotted on the X-axis. The chart should indicate the mean value and one, two, and three standard deviations above and below the mean for easy interpretation.
Even when a control value falls within 2 SD, it can still be a cause for concern. Levey–Jennings charts can help distinguish between normal variation and systematic error.
The first step in determining the validity of an assay is to ensure that the kit or assay is not expired and that the kit/assay controls meet the specified limits. Additional rules, such as the Westgard rules, can be applied to assess the validity of in-house control (IHC) sample results and determine whether they can be reported or need to be repeated.
To enhance efficiency and accuracy, a system using two or three controls for each run can be implemented. In such cases, additional rules can be employed to avoid rejecting runs that may actually be acceptable. These rules were developed and introduced to laboratory quality control by a clinical chemist named James Westgard. The Westgard multirule system involves running two controls with different target values for each set of examinations, creating a Levey–Jennings chart for each control, and applying the rules.
Using three controls with each run provides even higher assurance of the accuracy of the test run. When using three controls, it is advisable to select values representing low, normal, and high ranges. Westgard rules for a system with three controls are also available.
Westgard rules are utilized to define specific performance limits for a particular assay and can detect both random and systematic errors. If any of the following conditions are met, the assay run should be thoroughly investigated and repeated if necessary:
- The IHC shows three consecutive values more than one standard deviation above or below the mean IHC.
- The IHC shows two consecutive values more than two standard deviations above or below the mean IHC.
- The IHC shows one value more than three standard deviations above or below the mean IHC.
To get a high quality L-J chart, click here.
Be sure to get in touch incase you have any questions, I will be happy to assist you.
Comments ()