

Hello.
Let's map out the trading scenarios for the coming week.
I publish these "Trade Scenarios" posts on Sundays.
Then, on Saturdays, I publish a "Weekly Trade Report" reviewing how the market actually moved over the past week and where trading opportunities emerged based on those scenarios.
Going forward, the Saturday "Weekly Trade Report" will be available exclusively to newsletter subscribers, so if you're interested, please sign up for my newsletter. (It's free.)
By reading these reports alongside the Trade Scenarios posts, you can get a practical look at the consistent process behind my trading—how I plan ahead, what I wait for, and how I execute.
For more on the strategy itself, please see my blog post on Dow Theory and multi-timeframe analysis.
A scenario is not a prediction.
Rather than predicting what will happen, it's a plan built around "If this happens, I'll do that."
I don't try to predict the market, and that's not what these scenarios are intended to do, so please keep that in mind.
These posts are not intended to tell you when to buy or sell, nor do they provide trading signals.
They do not guarantee future profits and are provided solely for educational purposes, using my own thinking and the process that follows from it as examples.
I cannot take responsibility for any outcomes of your trades, so please trade at your own risk.
Let's start with USDJPY.
(The lines I've drawn on the charts represent price movements on different timeframes: orange for daily, red for 4h, blue for 1h, and green for 15m.)
USDJPY
Daily
Little has changed on the daily chart since last week, and price is currently in a range-like structure.
The broader market context remains the same, with price in a sell-the-rally area on the weekly chart and strong resistance just overhead, so I believe many traders are watching this area closely.
Weekly
The weekly chart is also largely unchanged from last week.
Price has broken below the most recent low, establishing a downtrend with a lower high and a lower low, and is now right in an area where traders would look to sell the rally.
Now let's return to the daily chart.
Daily
There is also strong support just below price, and the moving average is providing support as well.
Price is therefore caught between areas of buying and selling interest.
The clearest short setup would come after a break below these support levels, followed by a lower high forming with the moving average acting as resistance.
4h
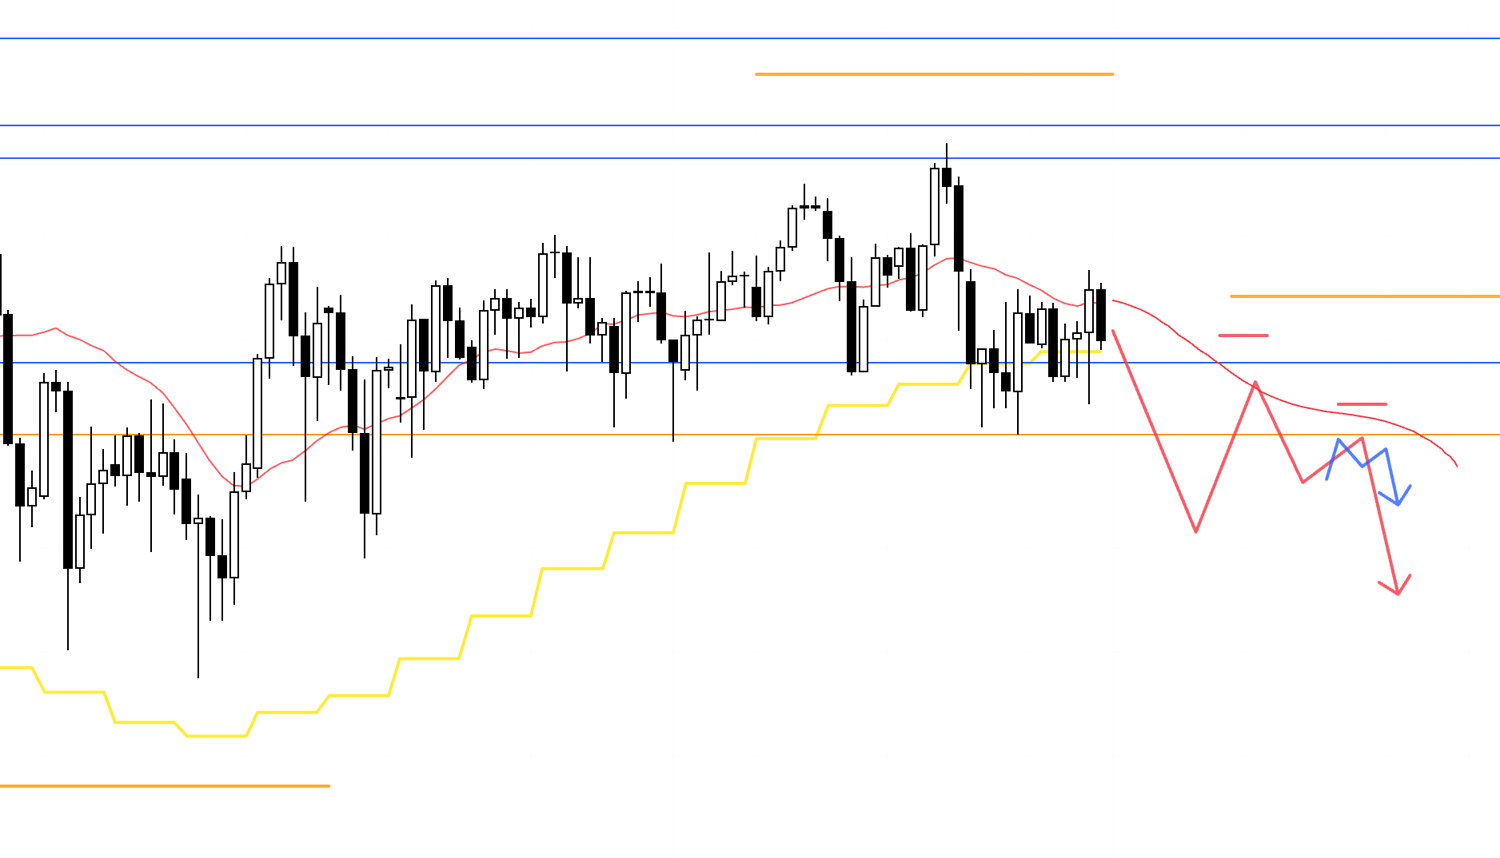
On the 4h chart, for example, price could first break below the support levels shown here, then rally into resistance from the moving average and those levels to form a lower high on the daily chart.
If the 4h chart also forms a lower high within that daily lower-high structure, I would consider selling on a lower timeframe.
If price develops this way, the weekly, daily, and 4h charts would all offer sell-the-rally setups.
Orders from traders across multiple timeframes would align on the sell side, creating a very strong bearish signal.
4h
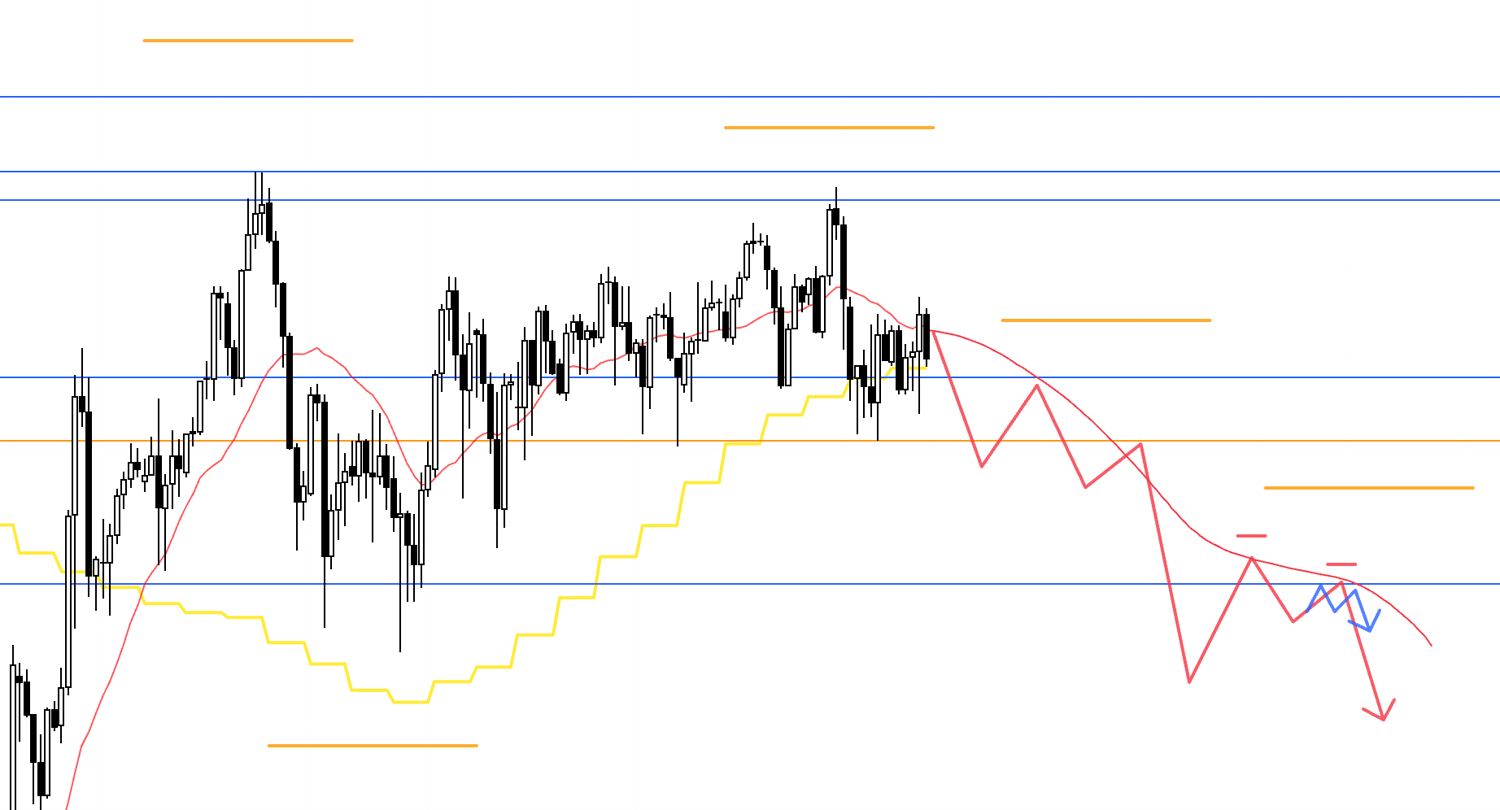
If price continues straight down, there are additional support levels just below, including the lower blue line, so I would need to keep these in mind when looking to sell a rally on the 4h chart.
If price then forms a lower high with that line acting as resistance, it could provide the next opportunity to consider selling.
4h
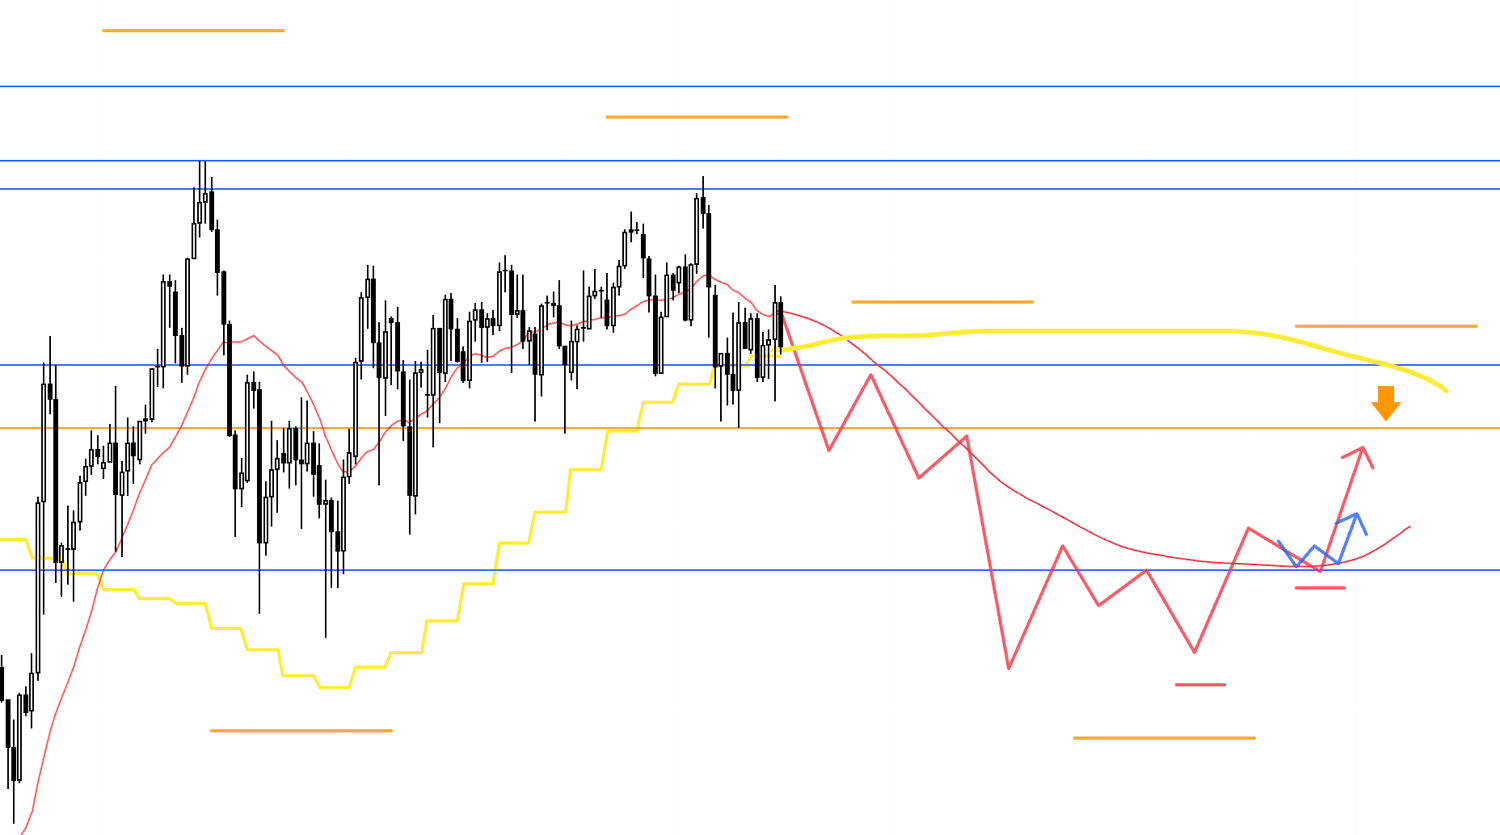
If price subsequently fails to extend much lower and instead finds support at this line, reversing into an uptrend on the 4h chart, I could also consider buying to capture the rally that forms a retracement on the daily chart.
In this case, the rally would follow a break below the previous daily low, attracting traders thinking, "I want to sell at higher prices."
The daily moving average would also be acting as overhead resistance, so I would need to see whether an entry opportunity emerges with a favorable risk-reward ratio.
Now let's move on to EURUSD.
EURUSD
Daily
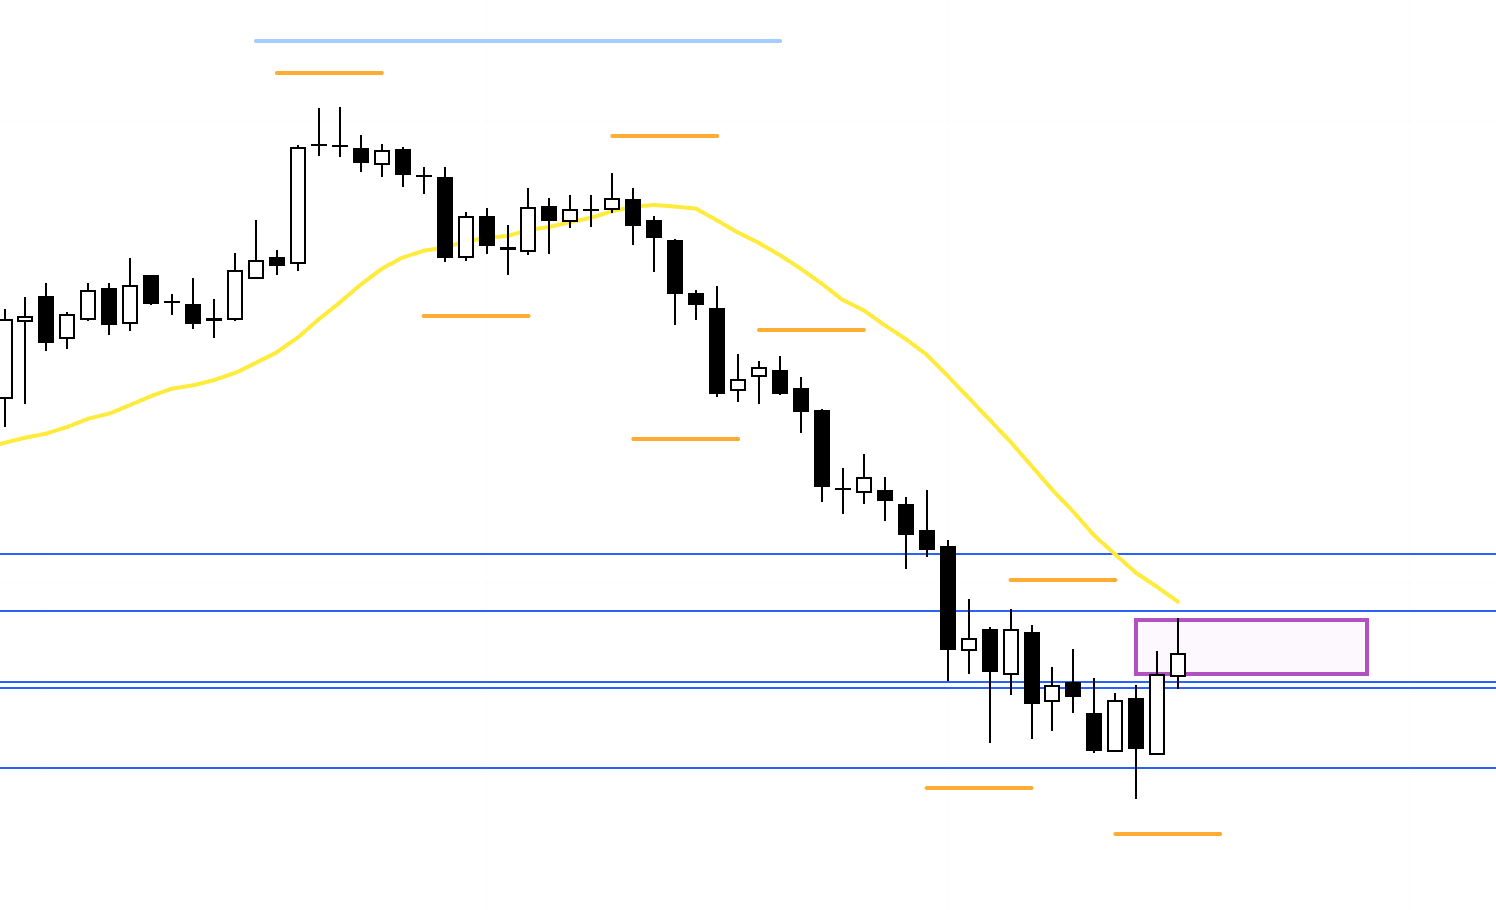
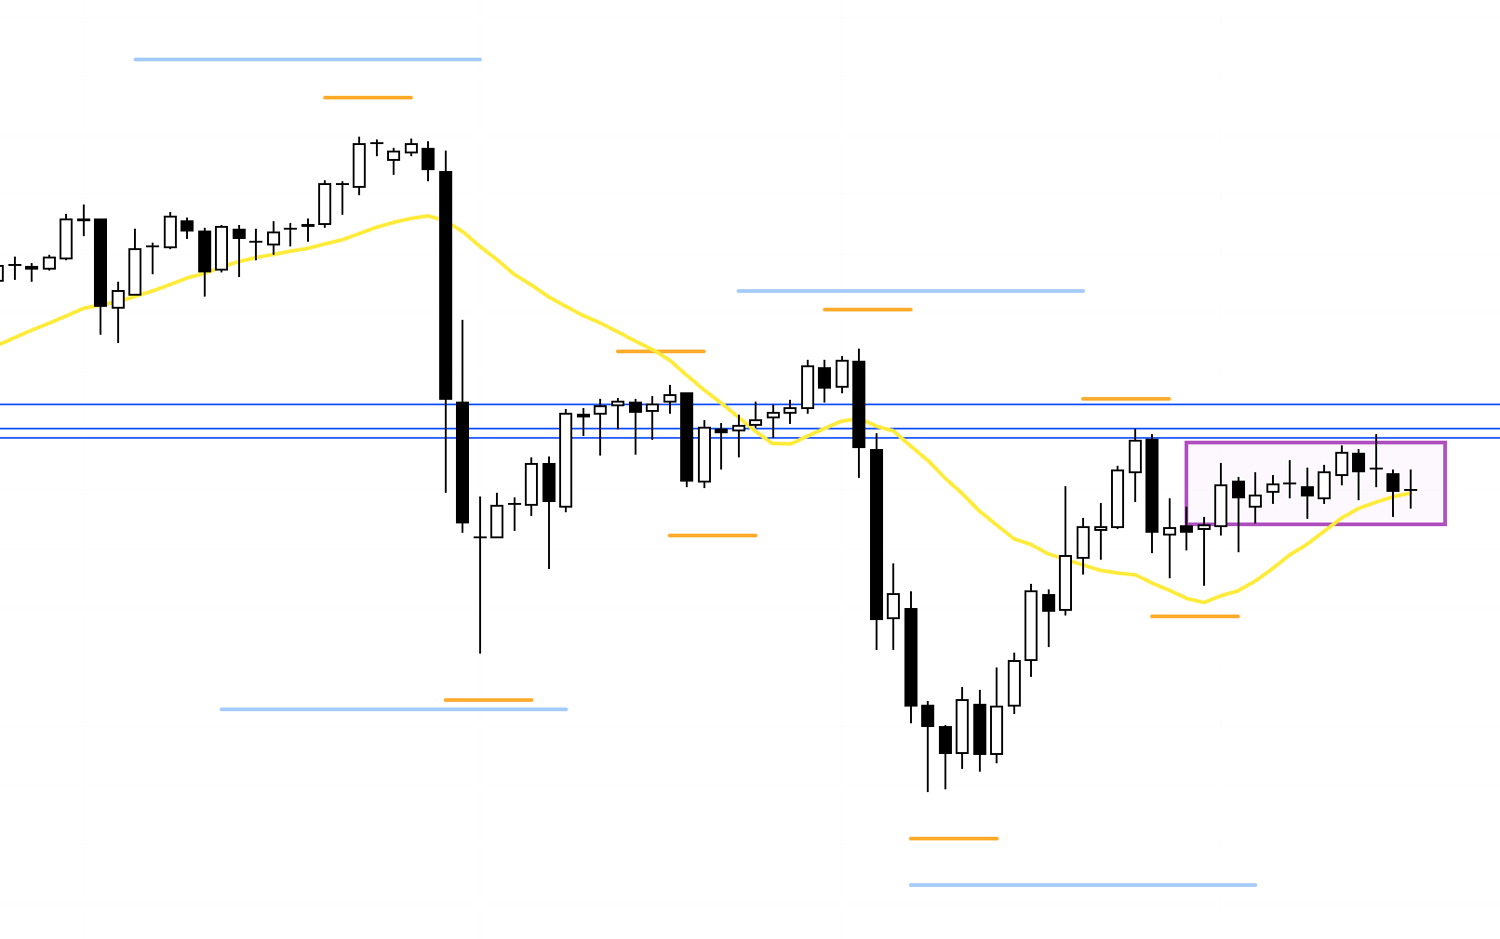
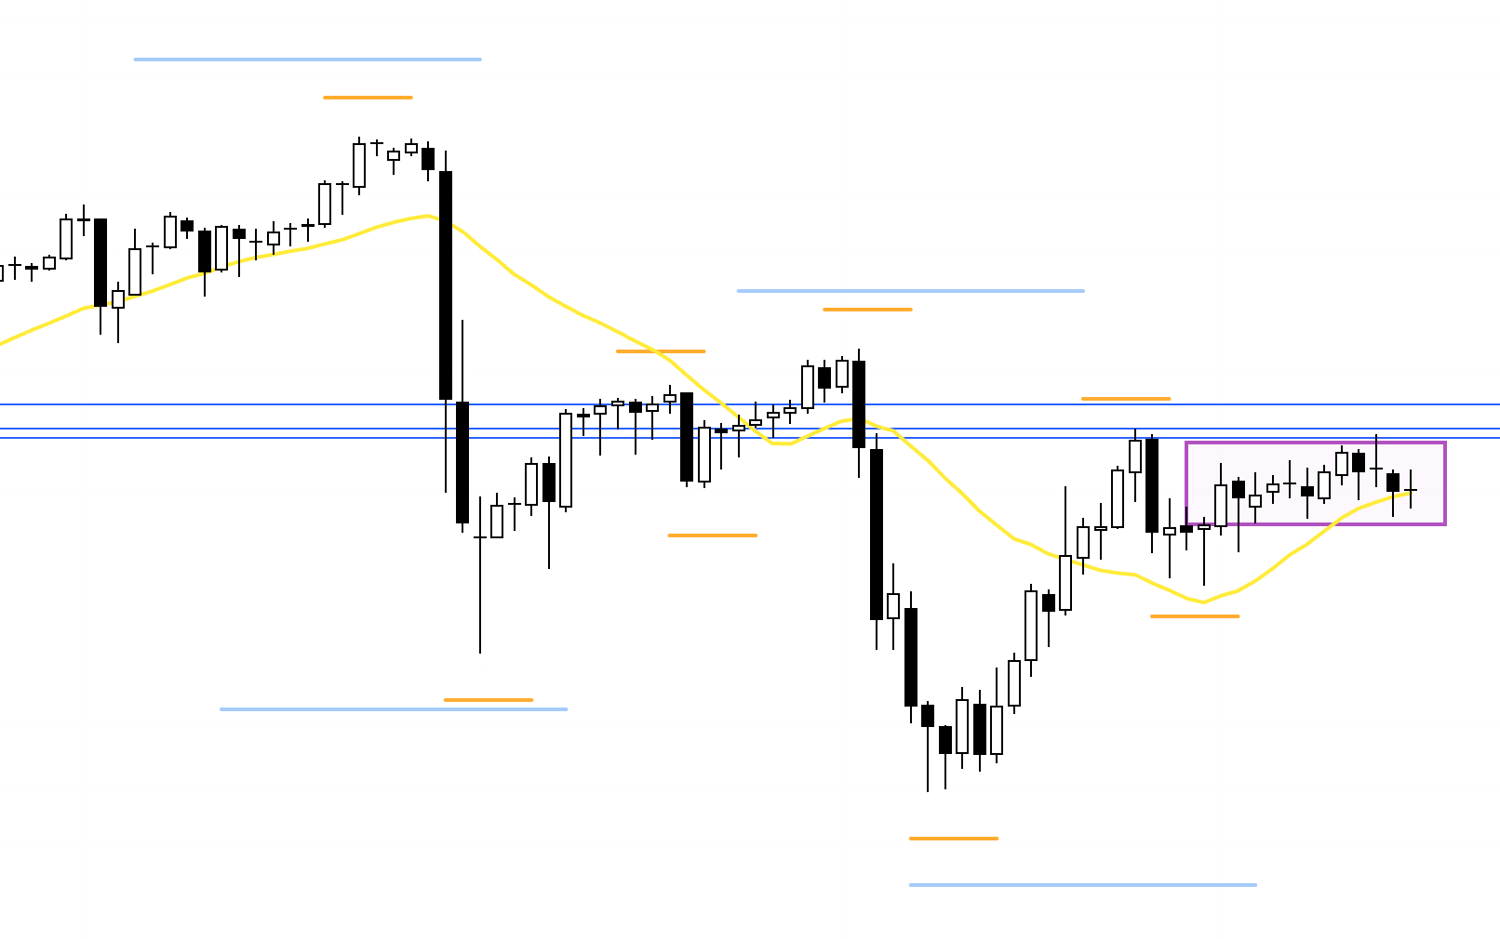
The daily chart is in a downtrend, so I would be looking for opportunities to sell rallies, but there is support just below price that calls for caution.
I do not plan to trade within the area marked by the purple rectangle.
I intend to base my trade plans on the price action that develops after a break above or below this area.
4h
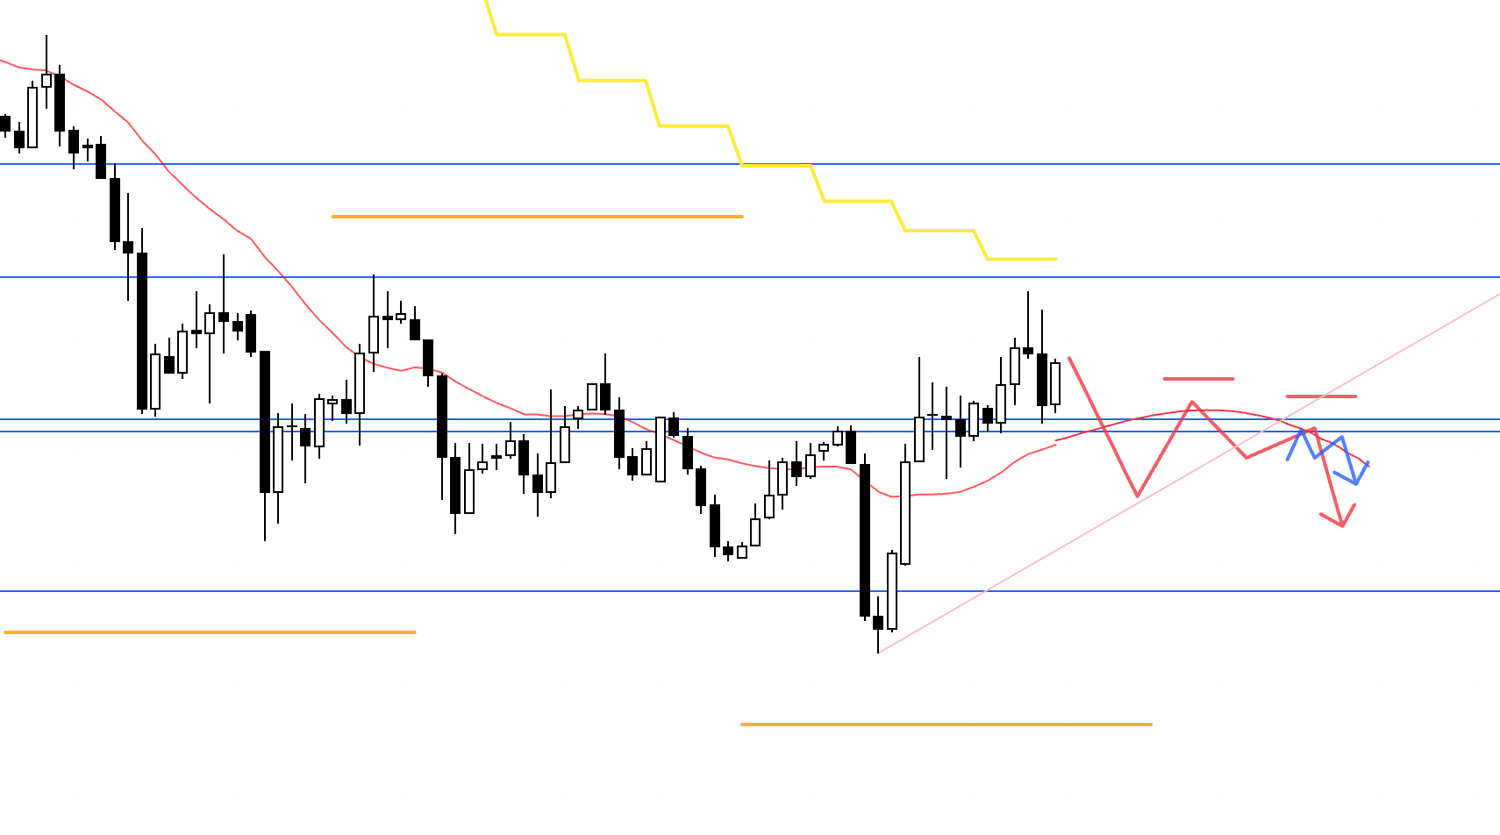
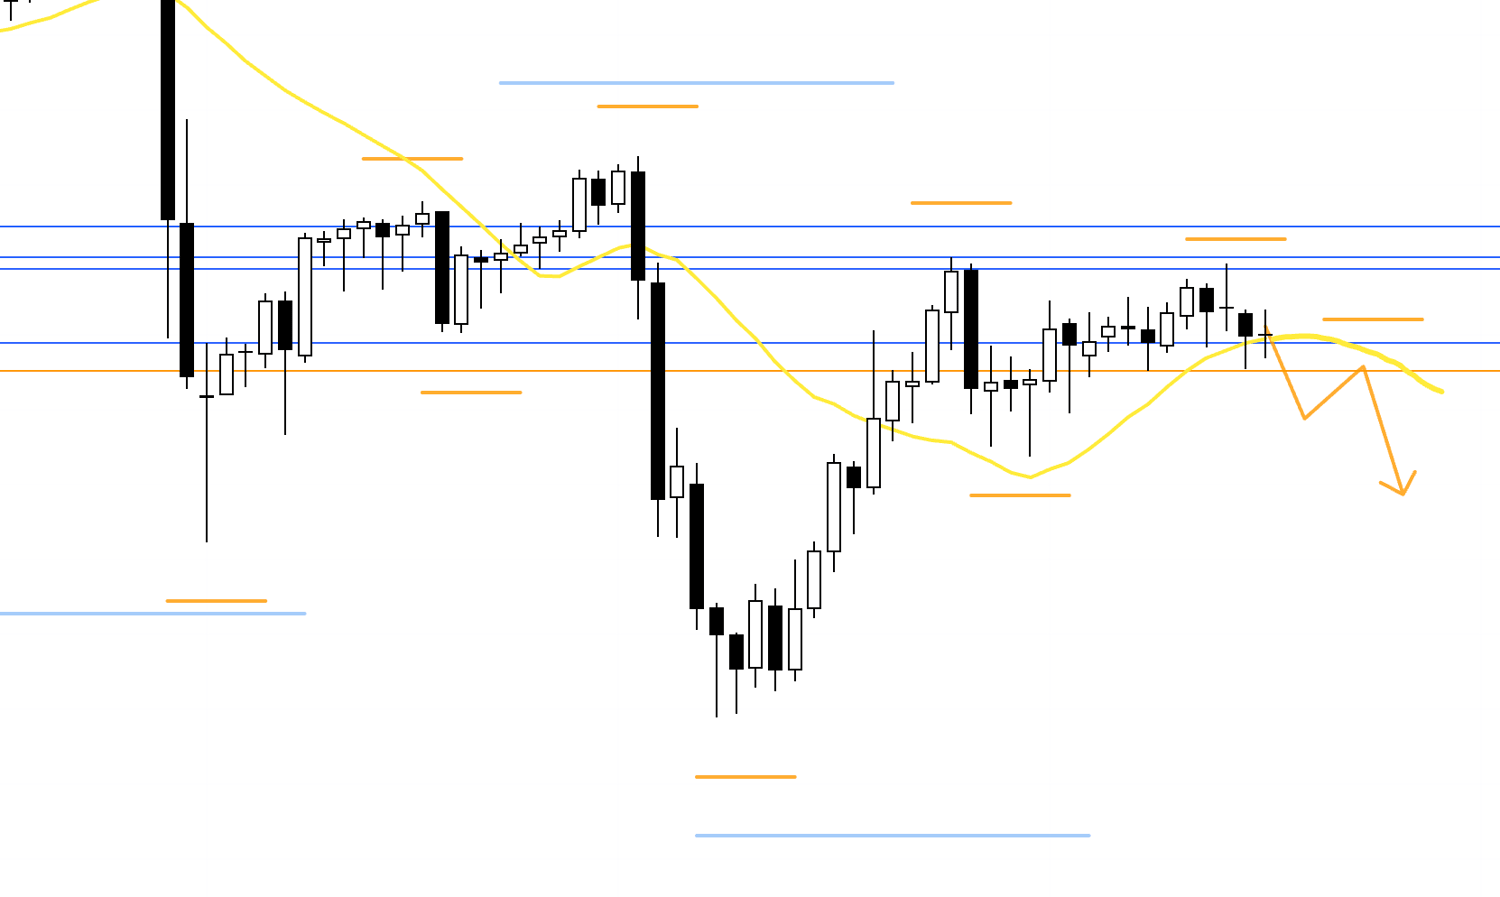
For example, if price first breaks below the support line as shown here, then forms a lower high with both that line and the MA acting as resistance, I would consider selling on a lower timeframe.
4h
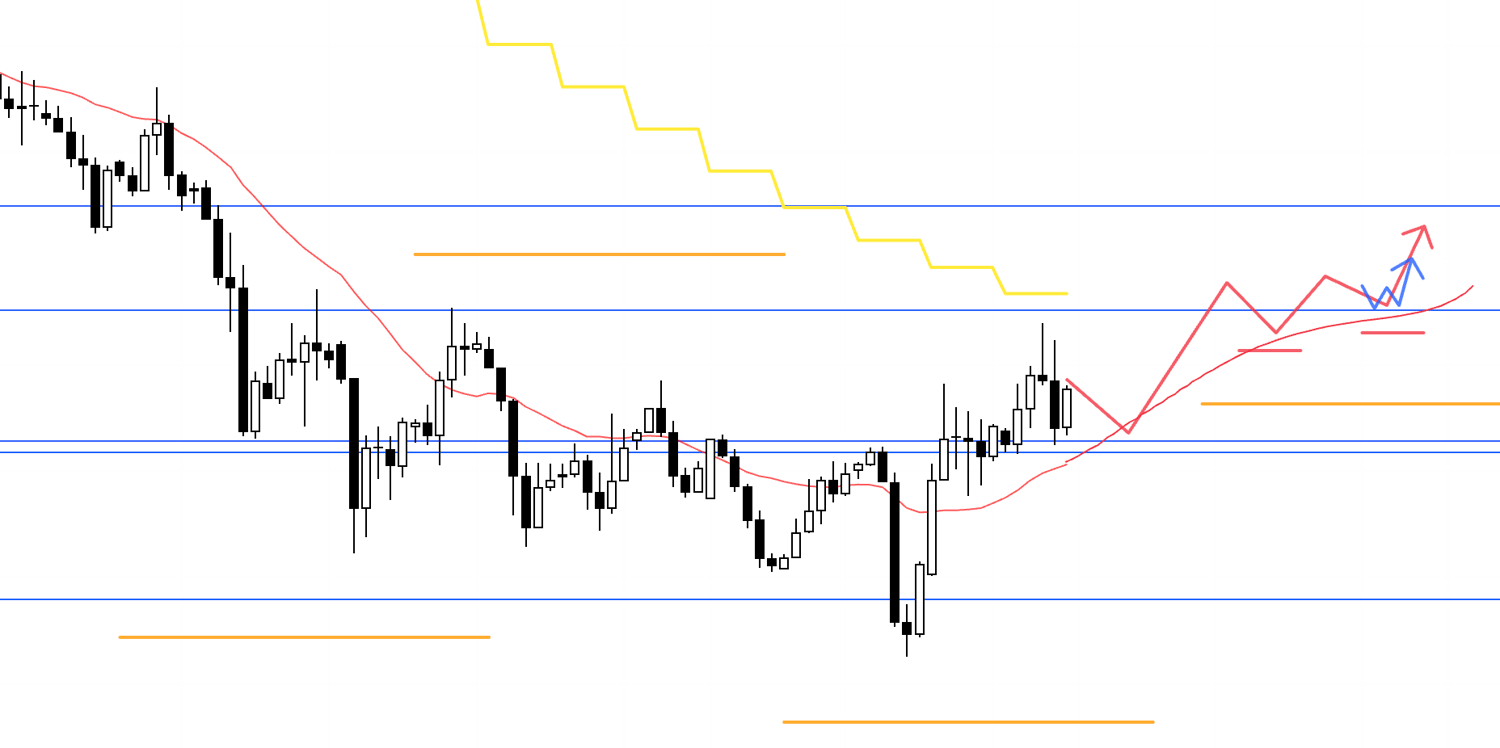
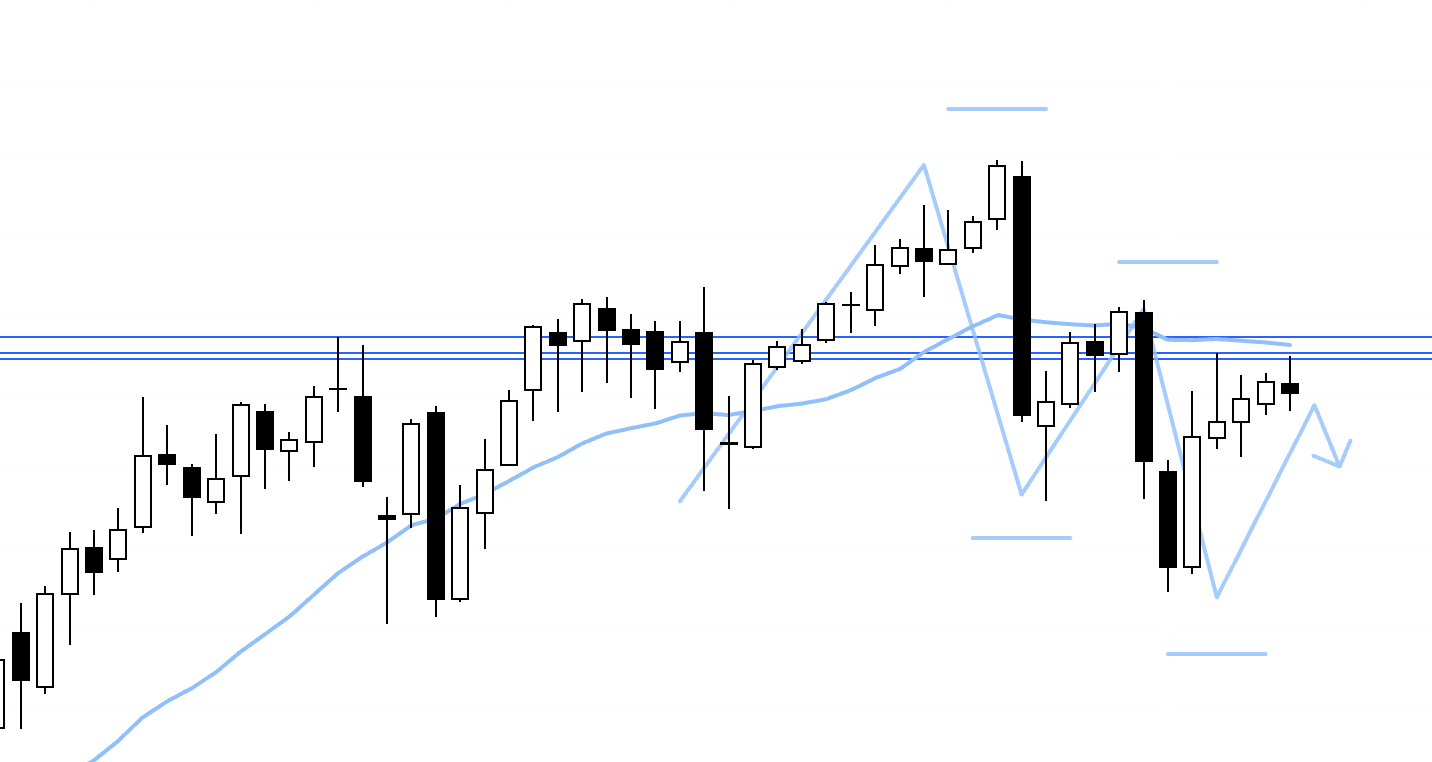
If price instead breaks above the upper resistance line and then finds support there, forming higher lows on both the daily and 4h charts as shown here, I would consider buying.
However, the next resistance level is also nearby, so I would pass on the trade if there were too little room before reaching it.
In any case, EURUSD remains caught between these levels, so I plan to update the scenarios as needed once the week begins, based on how price develops.
That's all for now.
These are just examples of scenarios I've developed from the current charts.
In practice, once the week begins, I update my scenarios in real time as the price action develops.
It would be difficult to share every update, but each time, I follow the same reasoning, assess risk in the same way, and make decisions using the same process.
I hope even these examples can give you some insight into that process.
The Saturday trade reports are available exclusively to newsletter subscribers, so if you're interested, please sign up for my newsletter.
You can read my previous blog posts here.
These trading scenarios are simply my own plans.
If you haven't yet established your own trading approach, I hope they can serve as a useful reference as you develop your strategy.
But if you already have a well-defined approach, please don't let my trading plans distract you from your own.
Stay committed to following your own rules.
Thank you for reading all the way to the end.