

Restaurant Profit & Food Cost Tracker
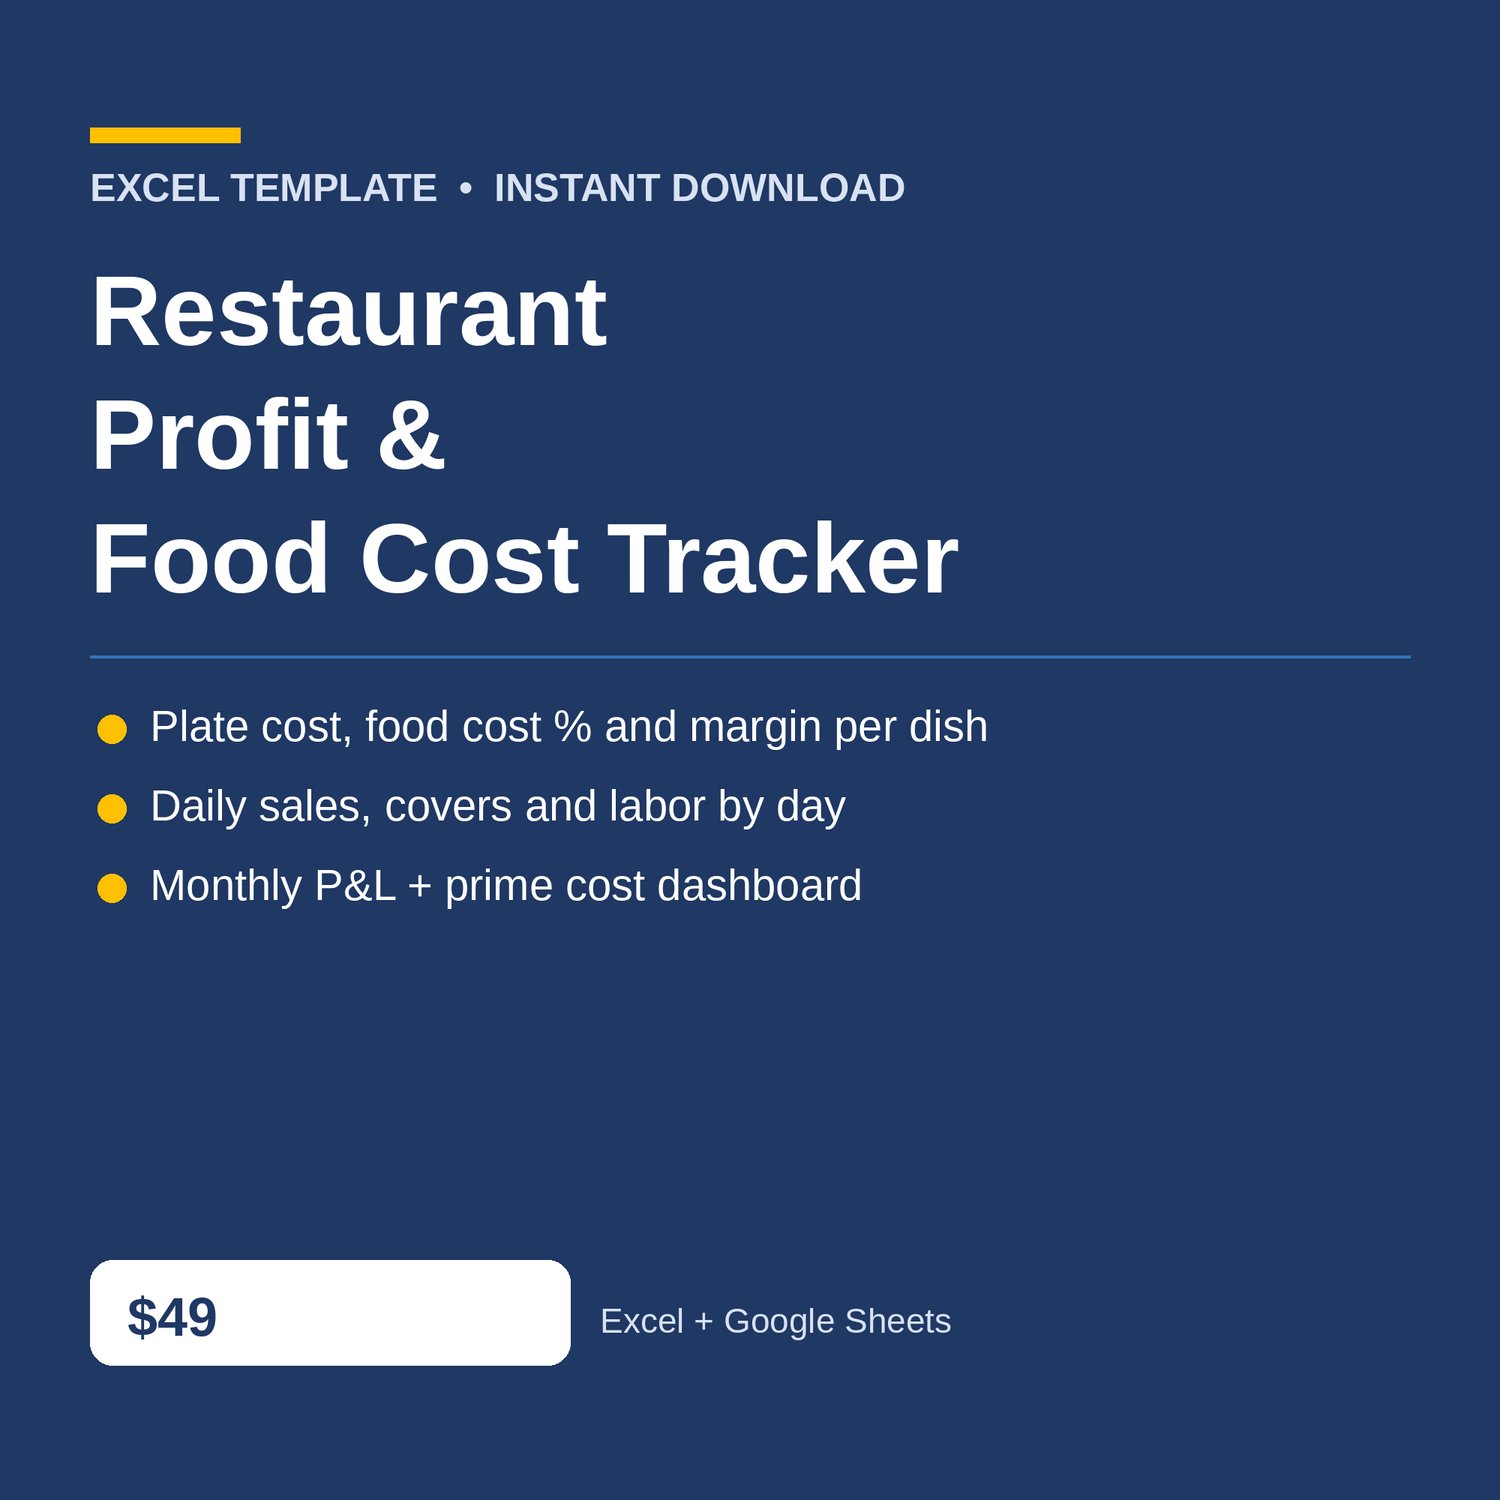
Restaurant Profit Tracker Excel with food cost calculator, menu pricing, labor cost, and a monthly P and L dashboard. Know what every dish actually costs — and whether the month actually made money.
Built for restaurant, cafe, and food truck owners who need to know, dish by dish and day by day, whether the price covers the plate and the payroll — without accounting software. If a dish is losing money, this workbook flags it before the next menu print.
WHAT'S INCLUDED (6 sheets):
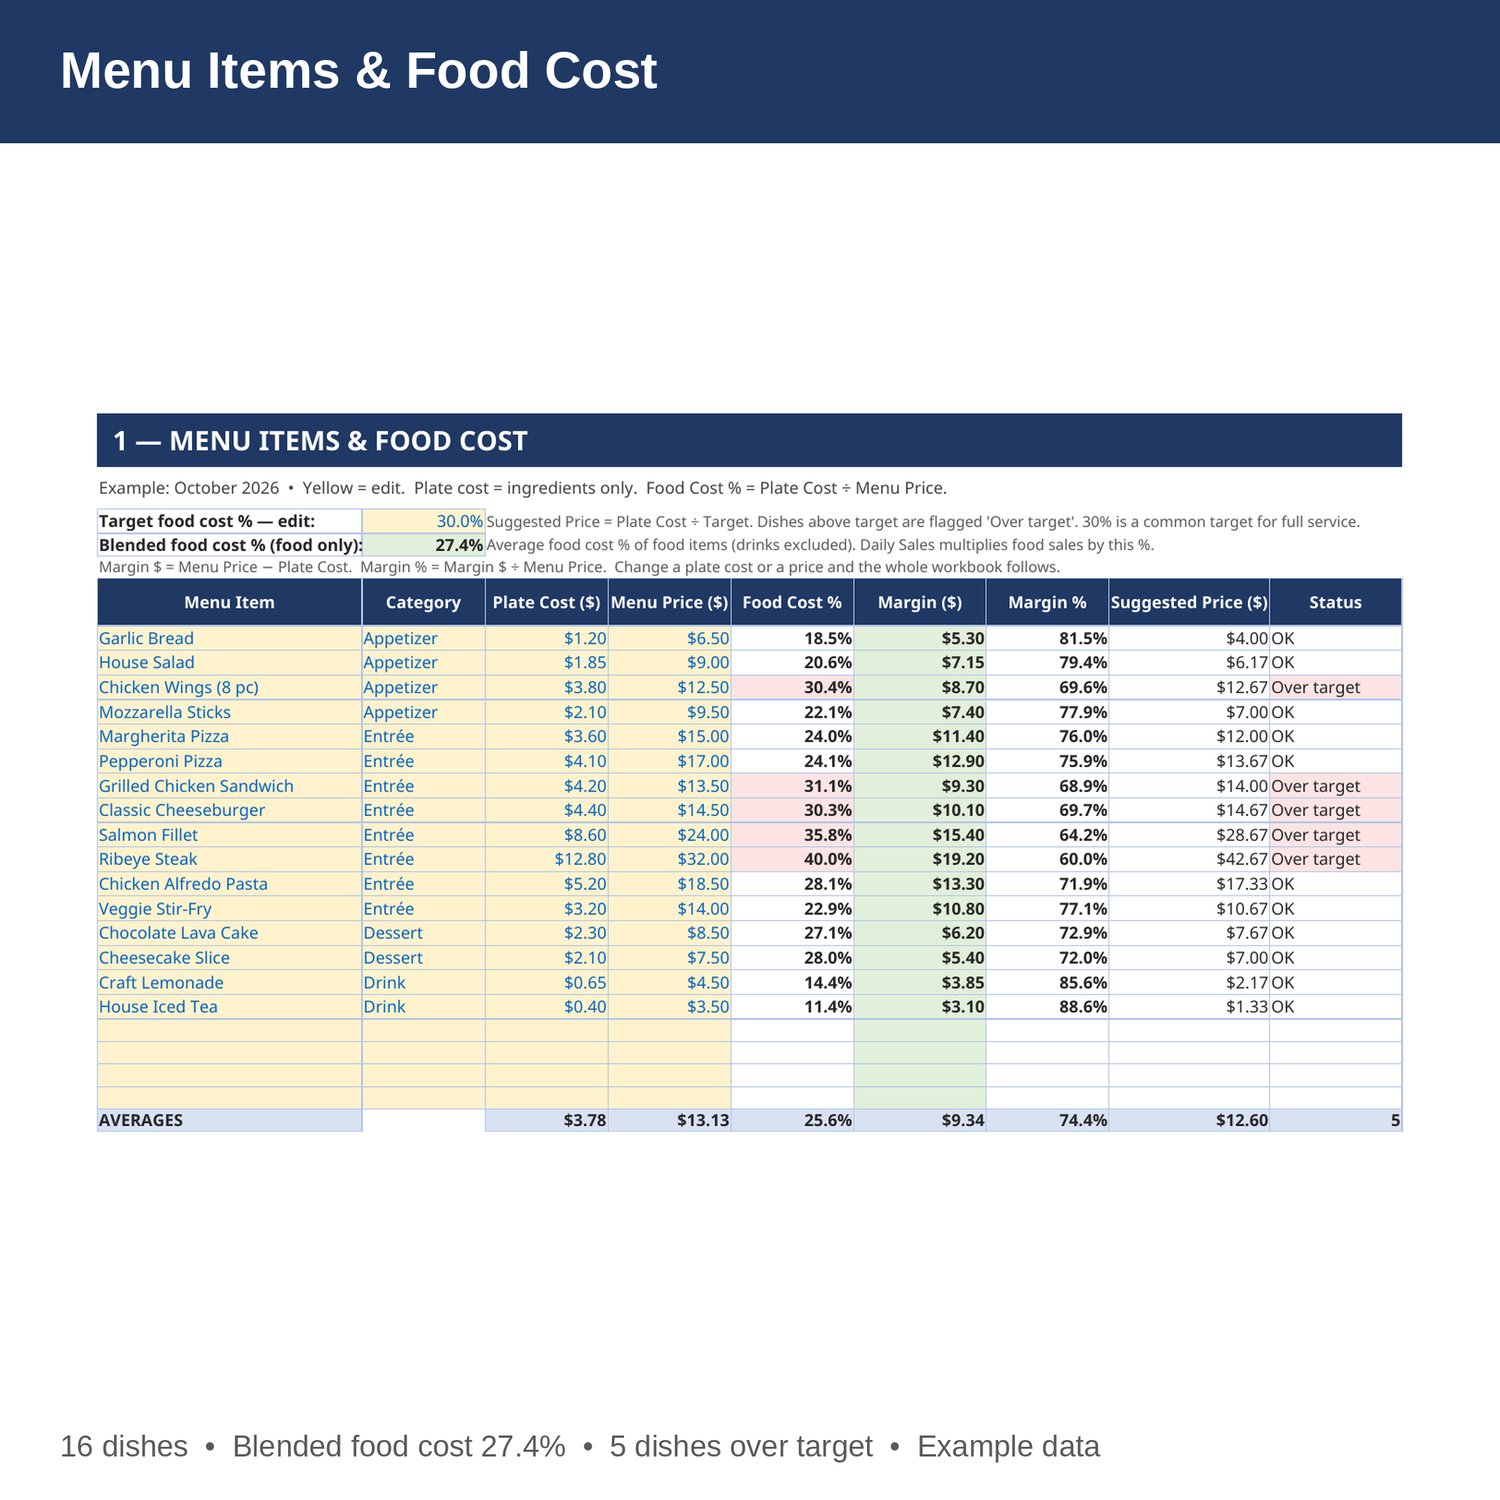
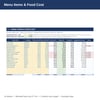
- Menu Items and Food Cost — plate cost (ingredients only), menu price, food cost percent, margin in dollars and percent, and a suggested price at your target food cost percent for every dish. Dishes over target are flagged. Change a plate cost or a price and the whole workbook follows.
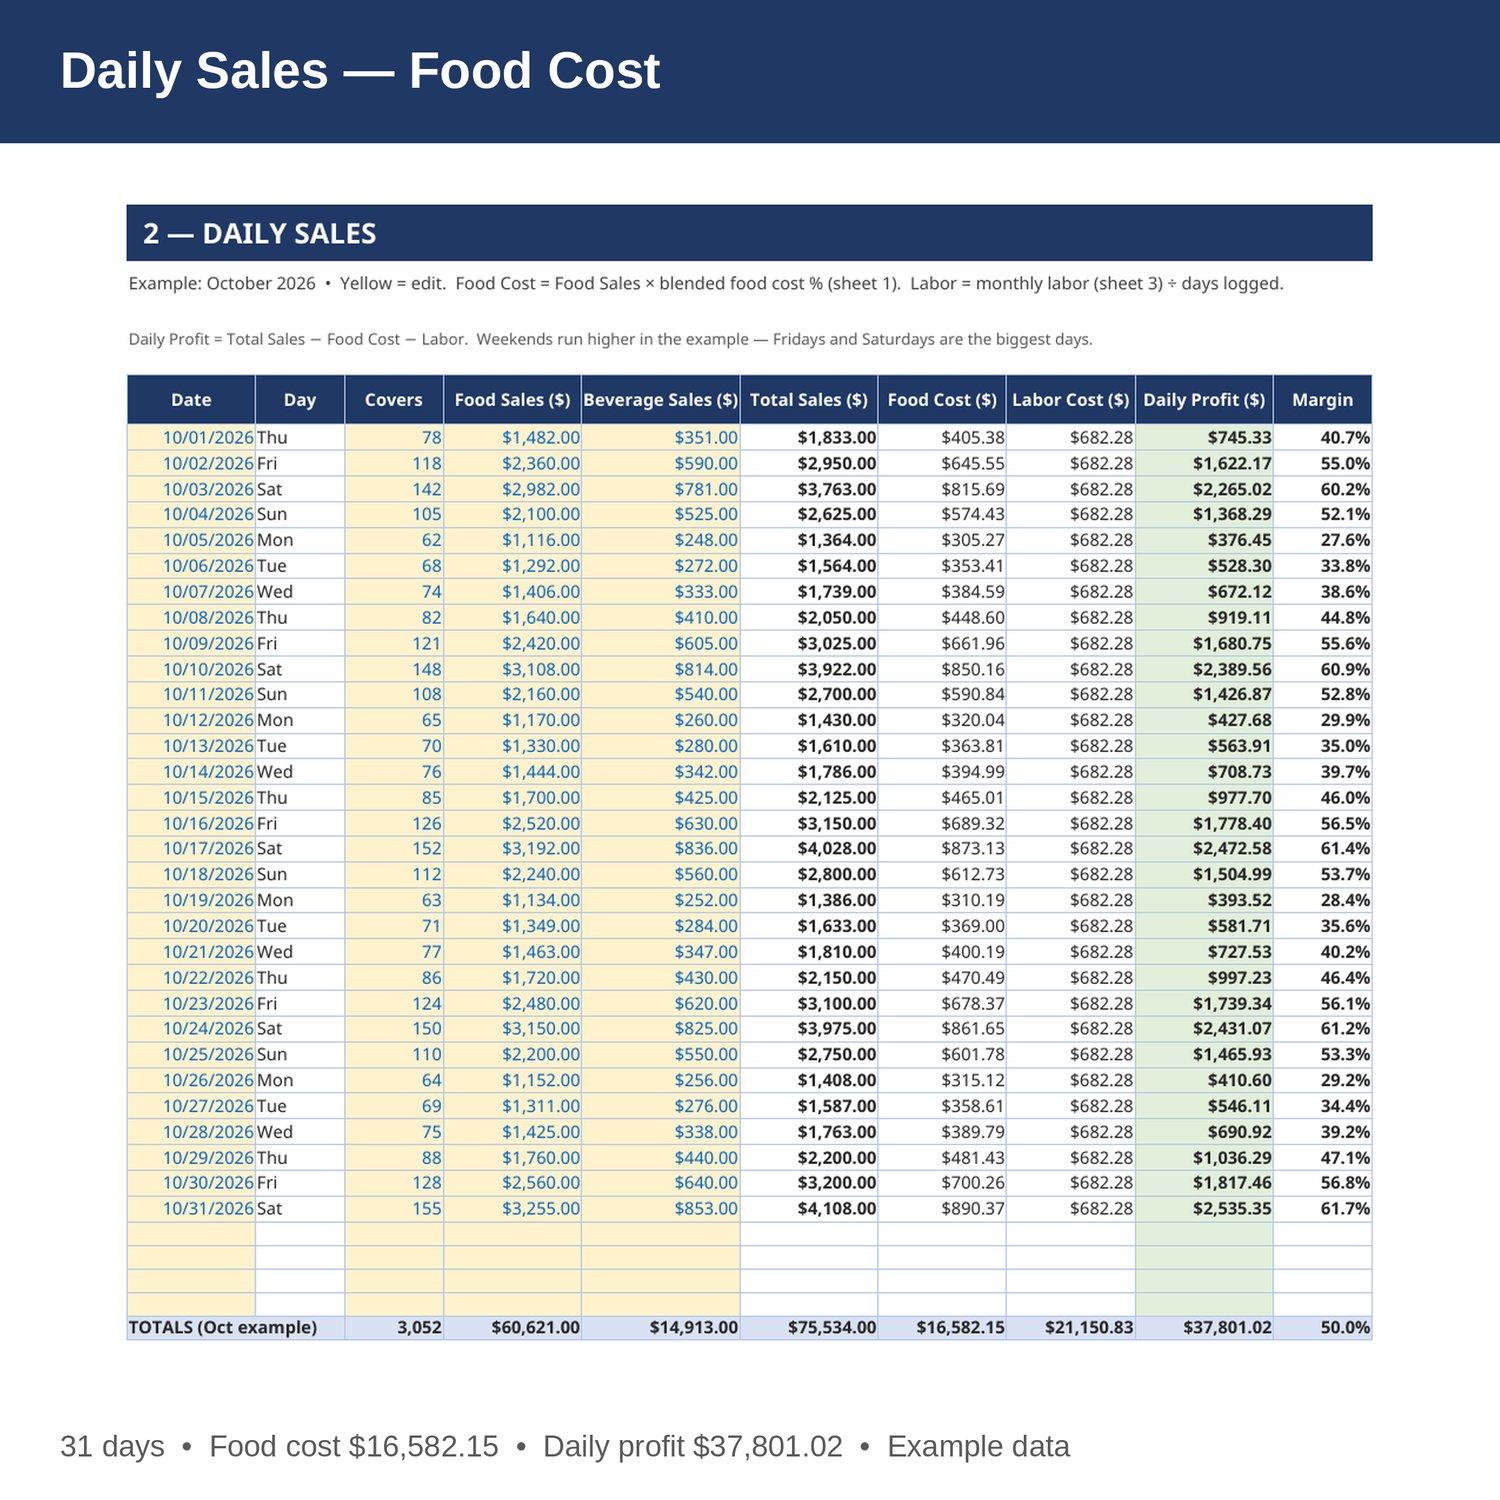
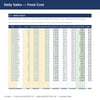
- Daily Sales — date, covers, food and beverage sales, food cost, labor, daily profit, and margin for every day. Food cost uses the blended food cost percent from the menu sheet; labor is the monthly labor cost from the Labor sheet spread across the days logged.
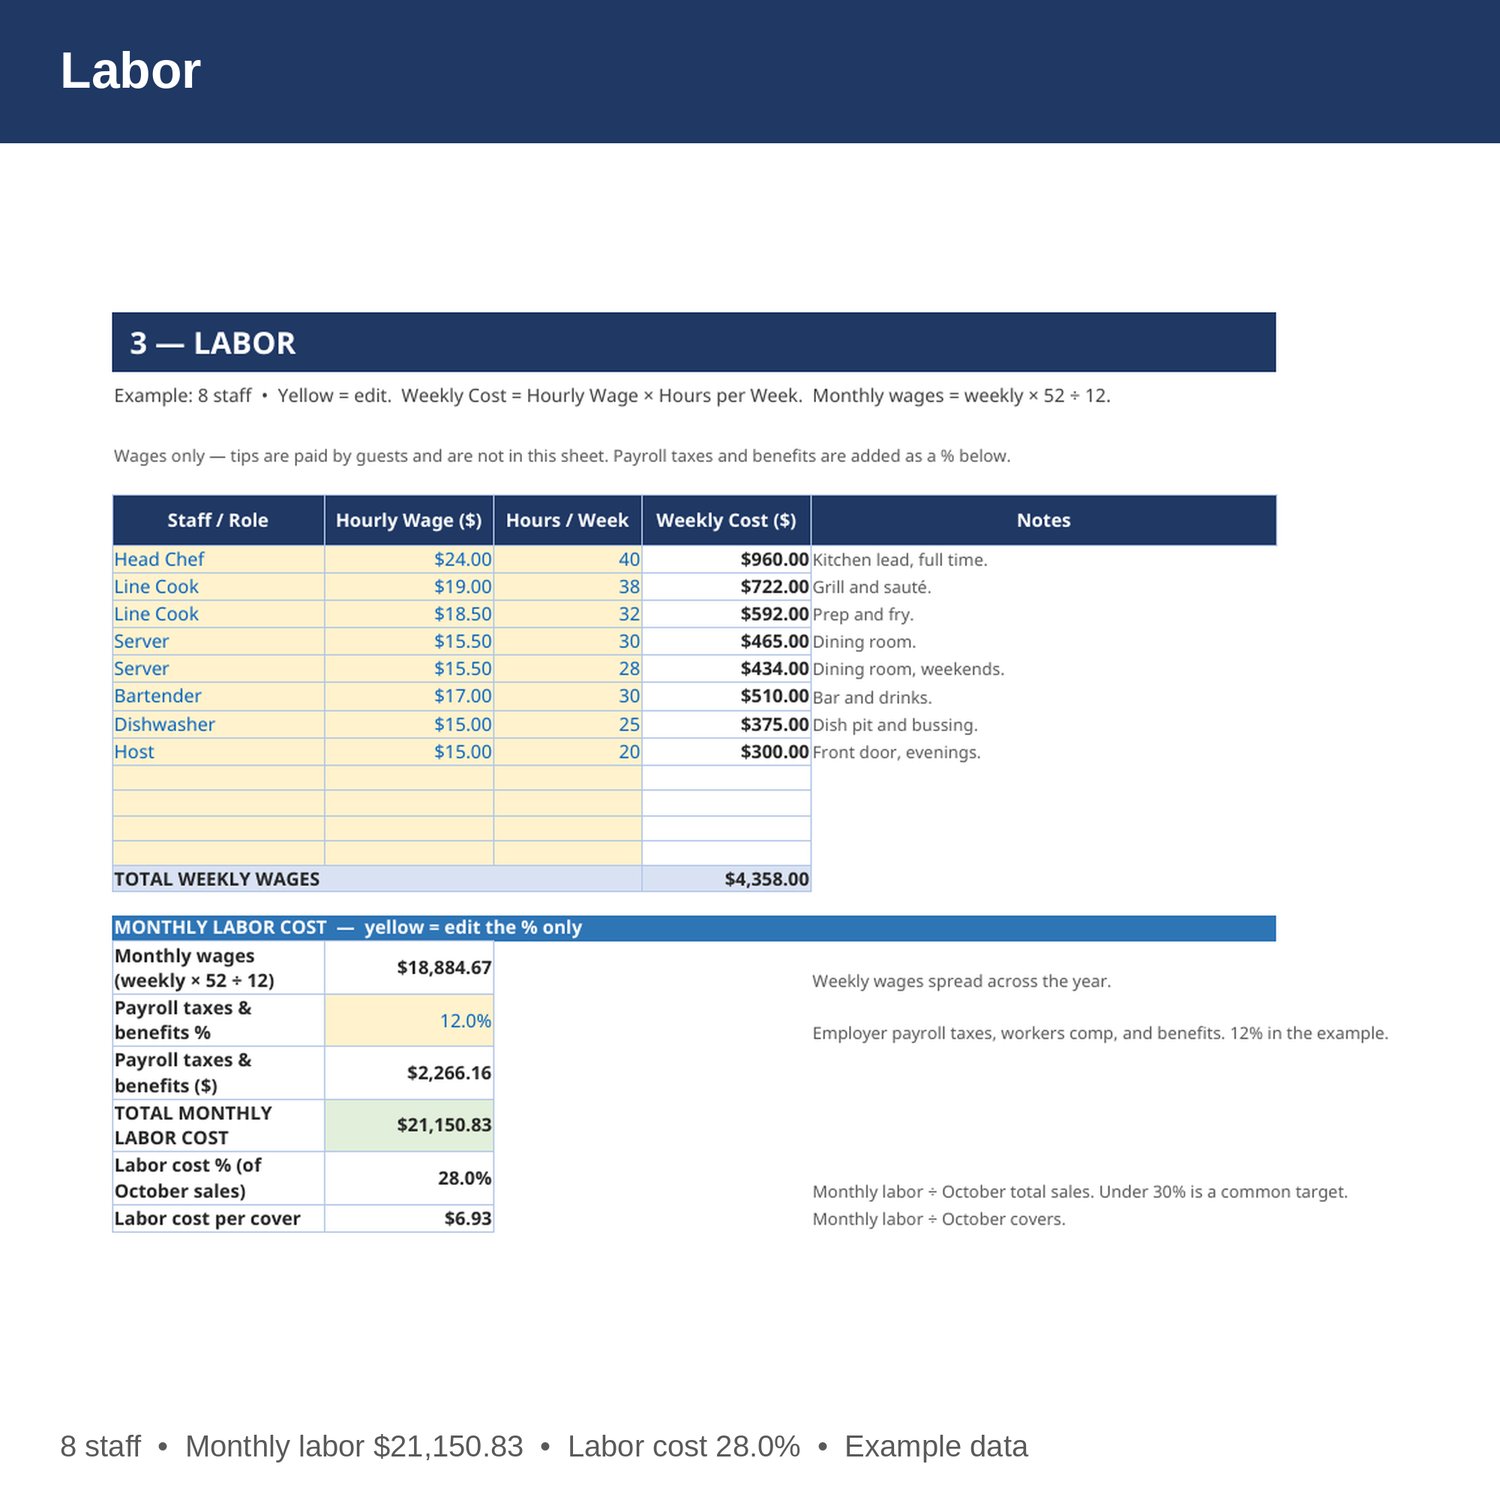
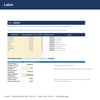
- Labor — staff roster with hourly wage and hours per week, weekly cost, monthly wages, payroll taxes and benefits as a percent, total monthly labor cost, labor cost percent, and labor cost per cover.
- Monthly P and L — covers, food and beverage sales, food cost, labor, rent, utilities, and other expenses by month, Jan-Dec, with net profit, margin, food cost percent, and labor cost percent. All formulas from sheets 1 to 3.
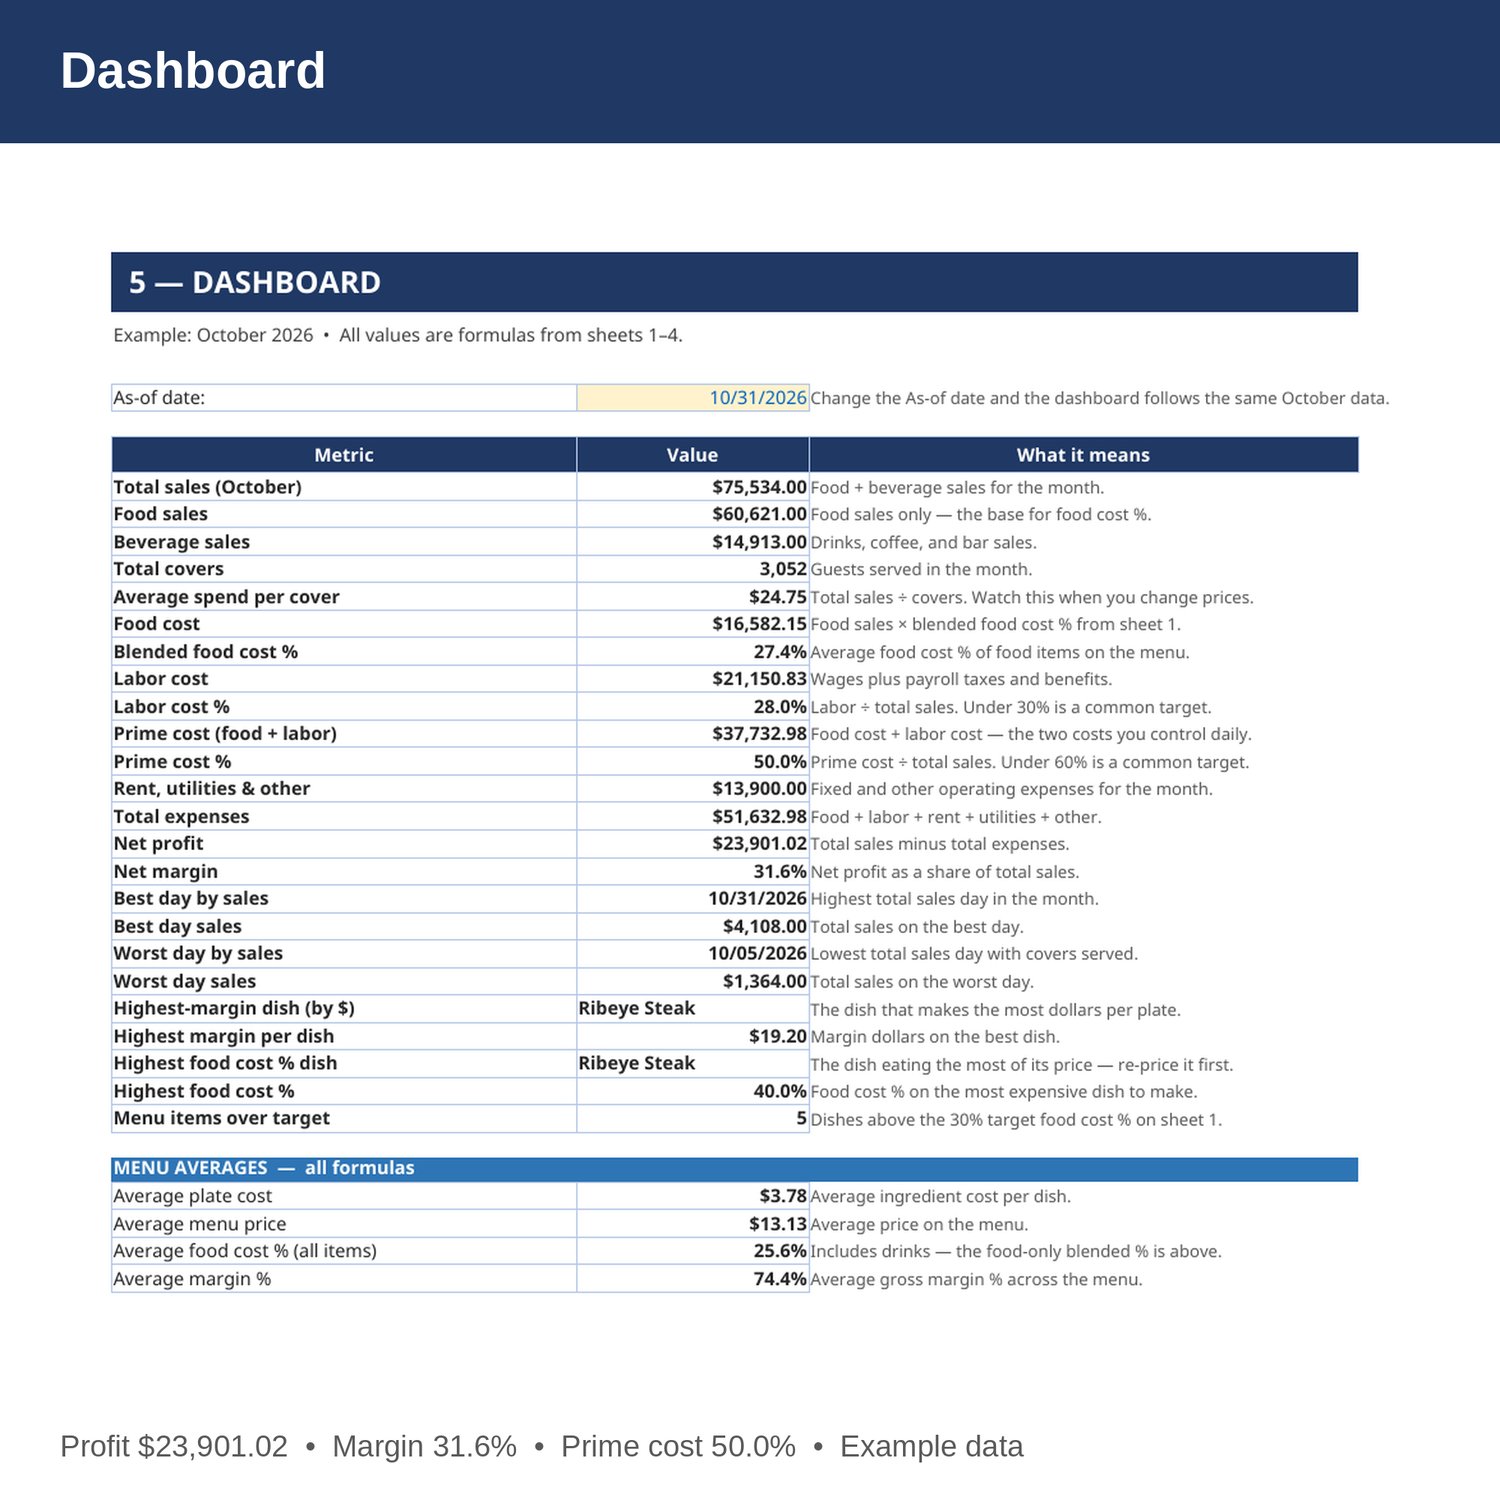
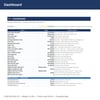
- Dashboard — total sales, covers, average spend per cover, food and labor cost, prime cost, net profit and margin, best and worst days, and your highest-margin and highest-cost dishes.
- Cover and How to Use — start here. Yellow cells are the only ones you edit.
EXAMPLE DATA (October 2026 — replace with your own numbers):
- Total sales 75,534 (food 60,621, beverage 14,913) from 3,052 covers; average spend per cover 24.75.
- Blended food cost 27.4 percent (food items only); food cost 16,582.15. Labor cost 21,150.83, or 28.0 percent of sales; labor cost per cover 6.93.
- Rent 6,500, utilities 2,000, other expenses 5,400; total expenses 51,632.98; net profit 23,901.02; margin 31.6 percent.
- Prime cost (food plus labor) 37,732.98, or 50.0 percent of sales. Daily profit after food cost and labor is 37,801.02.
- Best day: Saturday, October 31, sales 4,108. Worst day: Monday, October 5, sales 1,364.
- Menu example: average plate cost 3.78, average menu price 13.13, average margin 74.4 percent. 5 of 16 dishes sit over the 30 percent target food cost percent.
- Ribeye Steak is both the highest-margin dish (19.20 per plate) and the highest food cost dish (40.0 percent): plate cost 12.80, menu price 32.00, suggested price at the 30 percent target 42.67. Salmon Fillet is next at 35.8 percent food cost, margin 15.40, suggested price 28.67.
HOW IT WORKS:
1. Download the Excel file instantly after purchase.
2. On sheet 1, enter each dish's plate cost and menu price, and set your target food cost percent at the top (30 percent is a common target for full service).
3. On sheet 2, log covers, food sales, and beverage sales every day. Food cost, labor, and daily profit fill in by formula.
4. On sheet 3, keep the staff roster current — wage and hours per week — and set the payroll taxes and benefits percent.
5. Check prime cost on the Dashboard weekly. If food cost percent creeps over your target, re-price the flagged dishes on sheet 1.
HOW THE NUMBERS WORK:
Food cost percent is plate cost divided by menu price. Suggested price is plate cost divided by your target food cost percent. Blended food cost percent is the average food cost percent of food items only (drinks are excluded, because they cost almost nothing to make). Prime cost is food cost plus labor cost; under 60 percent of sales is a common target. Labor cost percent is total monthly labor divided by total sales; under 30 percent is a common target.
WHO IT'S FOR:
Restaurant, cafe, food truck, and small catering owners who want plate costs, daily profit, labor cost, and a monthly P and L in one workbook — without accounting software.
PLEASE NOTE:
- This is a digital download. No physical item will be shipped.
- Works in Microsoft Excel and Google Sheets (upload to Google Drive to open in Sheets).
- Example data for October 2026 is included (16 menu items, 31 days, 3,052 covers, 8 staff). Replace it with your own numbers.
- The example is simplified: insurance, marketing, supplies, repairs, and licenses are bundled into the single Other Expenses line on the P and L, so the example margin is higher than a fully-loaded real month.
- This is a bookkeeping and planning tool only, not tax, legal, or CPA advice.
- Due to the nature of digital downloads, refunds are not available. Message me before buying if you have a question.
Built by an accountant: B.S. Accountancy, ASU W. P. Carey, with revenue-reconciliation experience at Marriott and audit work at PwC.