
COVID-19 US Tracking Dashboard Power BI
On Sale
$40.00
$40.00
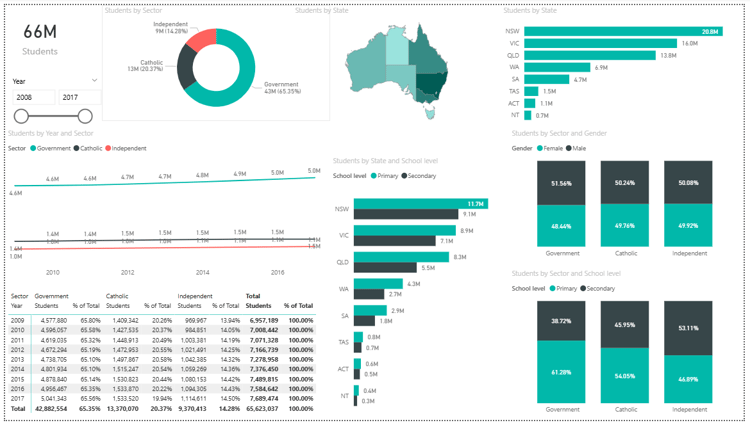
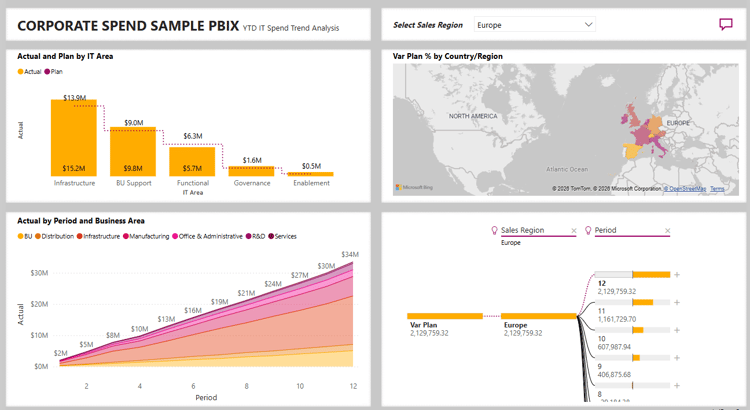
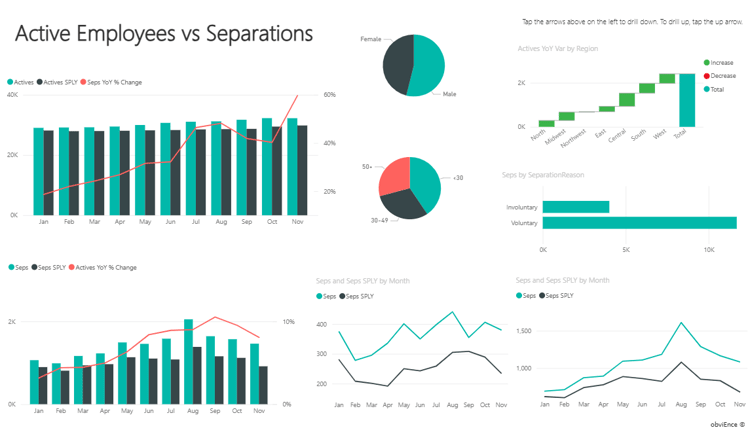
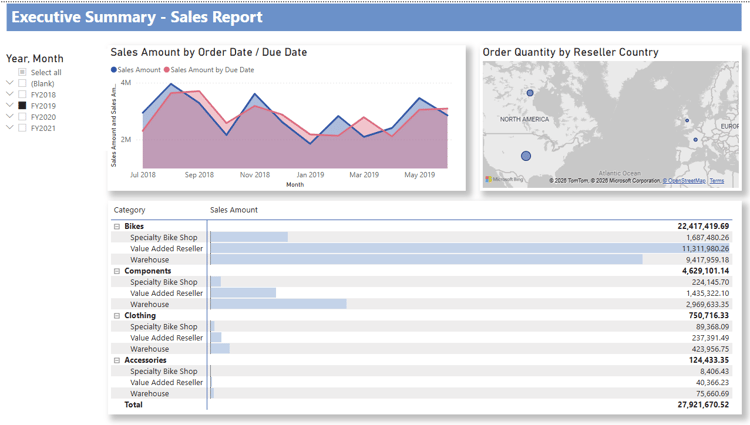
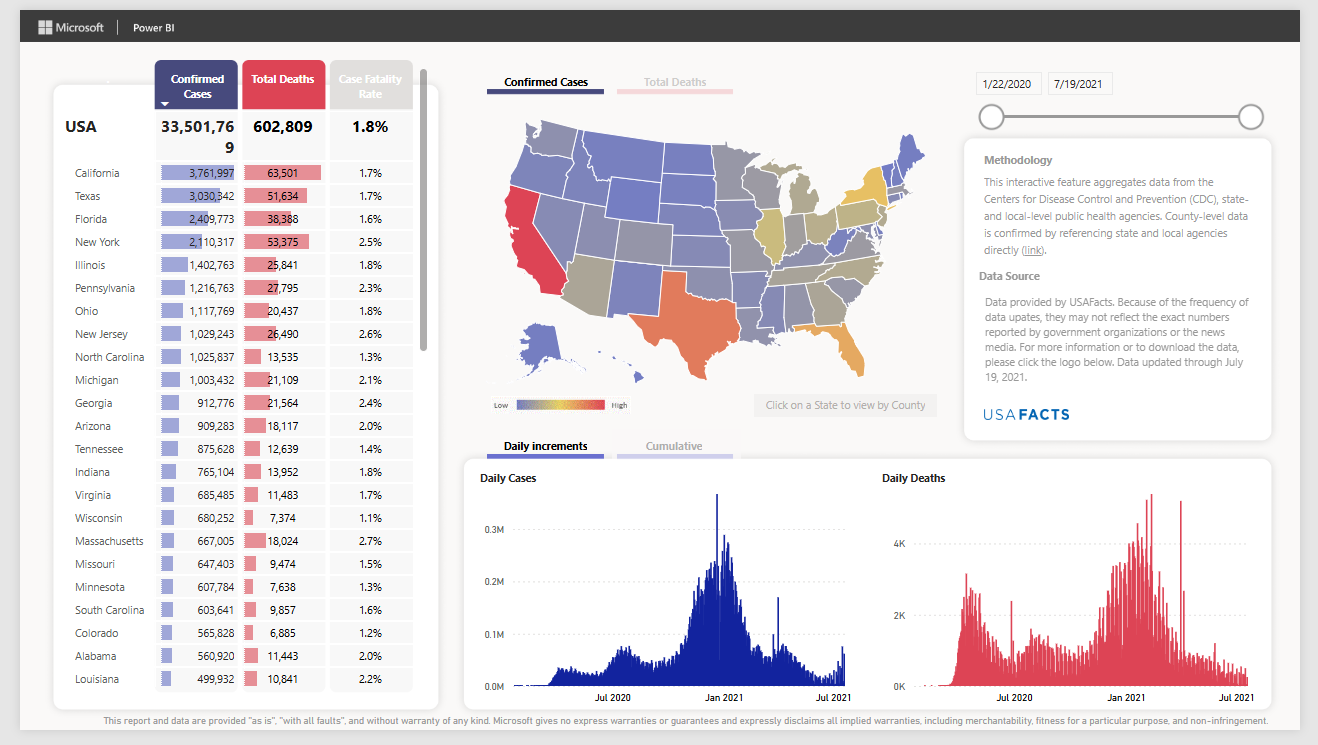
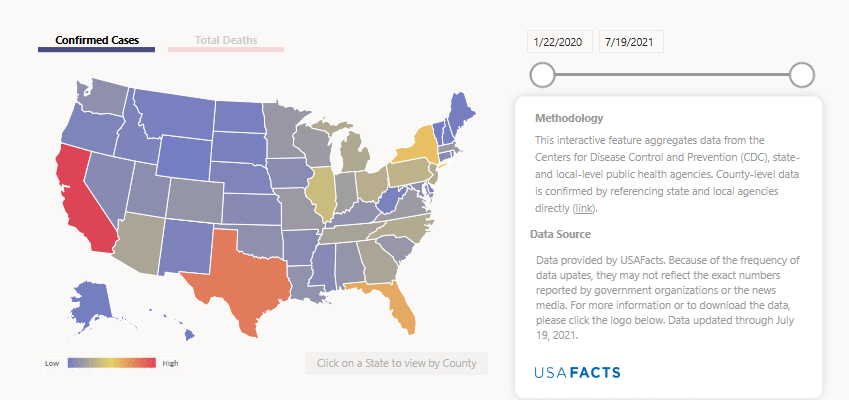
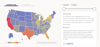
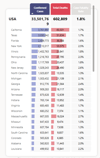
A professional COVID-19 US Tracking Sample Dashboard built using Power BI, designed to visualize and monitor the spread and impact of COVID-19 across the United States.
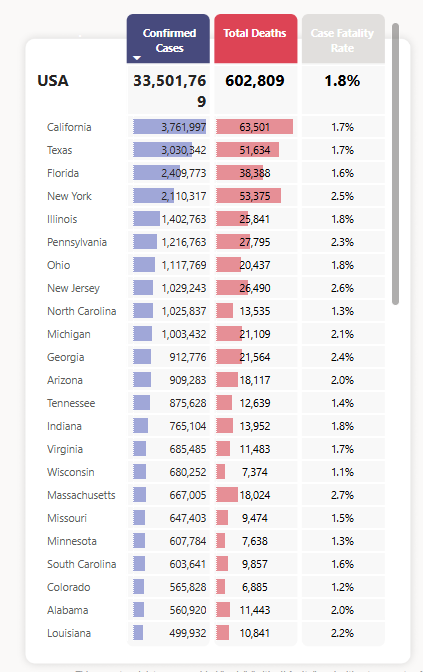
The dashboard provides clear insights into confirmed cases, deaths, recoveries, testing trends, and state-level comparisons, all presented through interactive and easy-to-read visualizations.
Created as a sample project, this dashboard is ideal for demonstrating data visualization, public health analytics, and Power BI reporting skills.
⭐ Key Features
- COVID-19 case tracking across U.S. states
- Trends analysis for cases & deaths
- Interactive maps and charts
- Clean, informative Power BI design
- Suitable for demos & portfolios
🎯 Best For
- Power BI portfolios
- Data visualization demos
- Public health analytics samples
- Training and learning purposes