







Multi-Timeframe Explained — Measured (PDF Guide)
You are told to check the higher timeframe and it never quite helps. The two charts disagree more often than not, the advice assumes one of them is more real than the other, and nobody has ever told you what actually changes when you switch - or what stays exactly the same.
Both, measured. Per bar the three timeframes produce 185.25, 201.08 and 204.37 swings per thousand - almost identical, because the chart is self-similar. Per thirty days they produce 133.38, 24.13 and 6.13. The timeframe does not change the shape of what you see. It changes how much time fits on the screen. This is a 36-page PDF that teaches Multi-Timeframe Analysis from the first thing you see on the screen through to a written strategy with an entry, a stop and an explicit rule for when the trade is wrong.
Nothing is taught underneath a chart. Every label sits on the candle, the line or the level it is describing, on real BTC, ETH, SOL and LINK charts. There are three quizzes on real charts, each followed by the same chart re-shown annotated with the reasoning, plus faded practice pages where the first steps are filled in and you finish the rest.
WHAT'S INSIDE
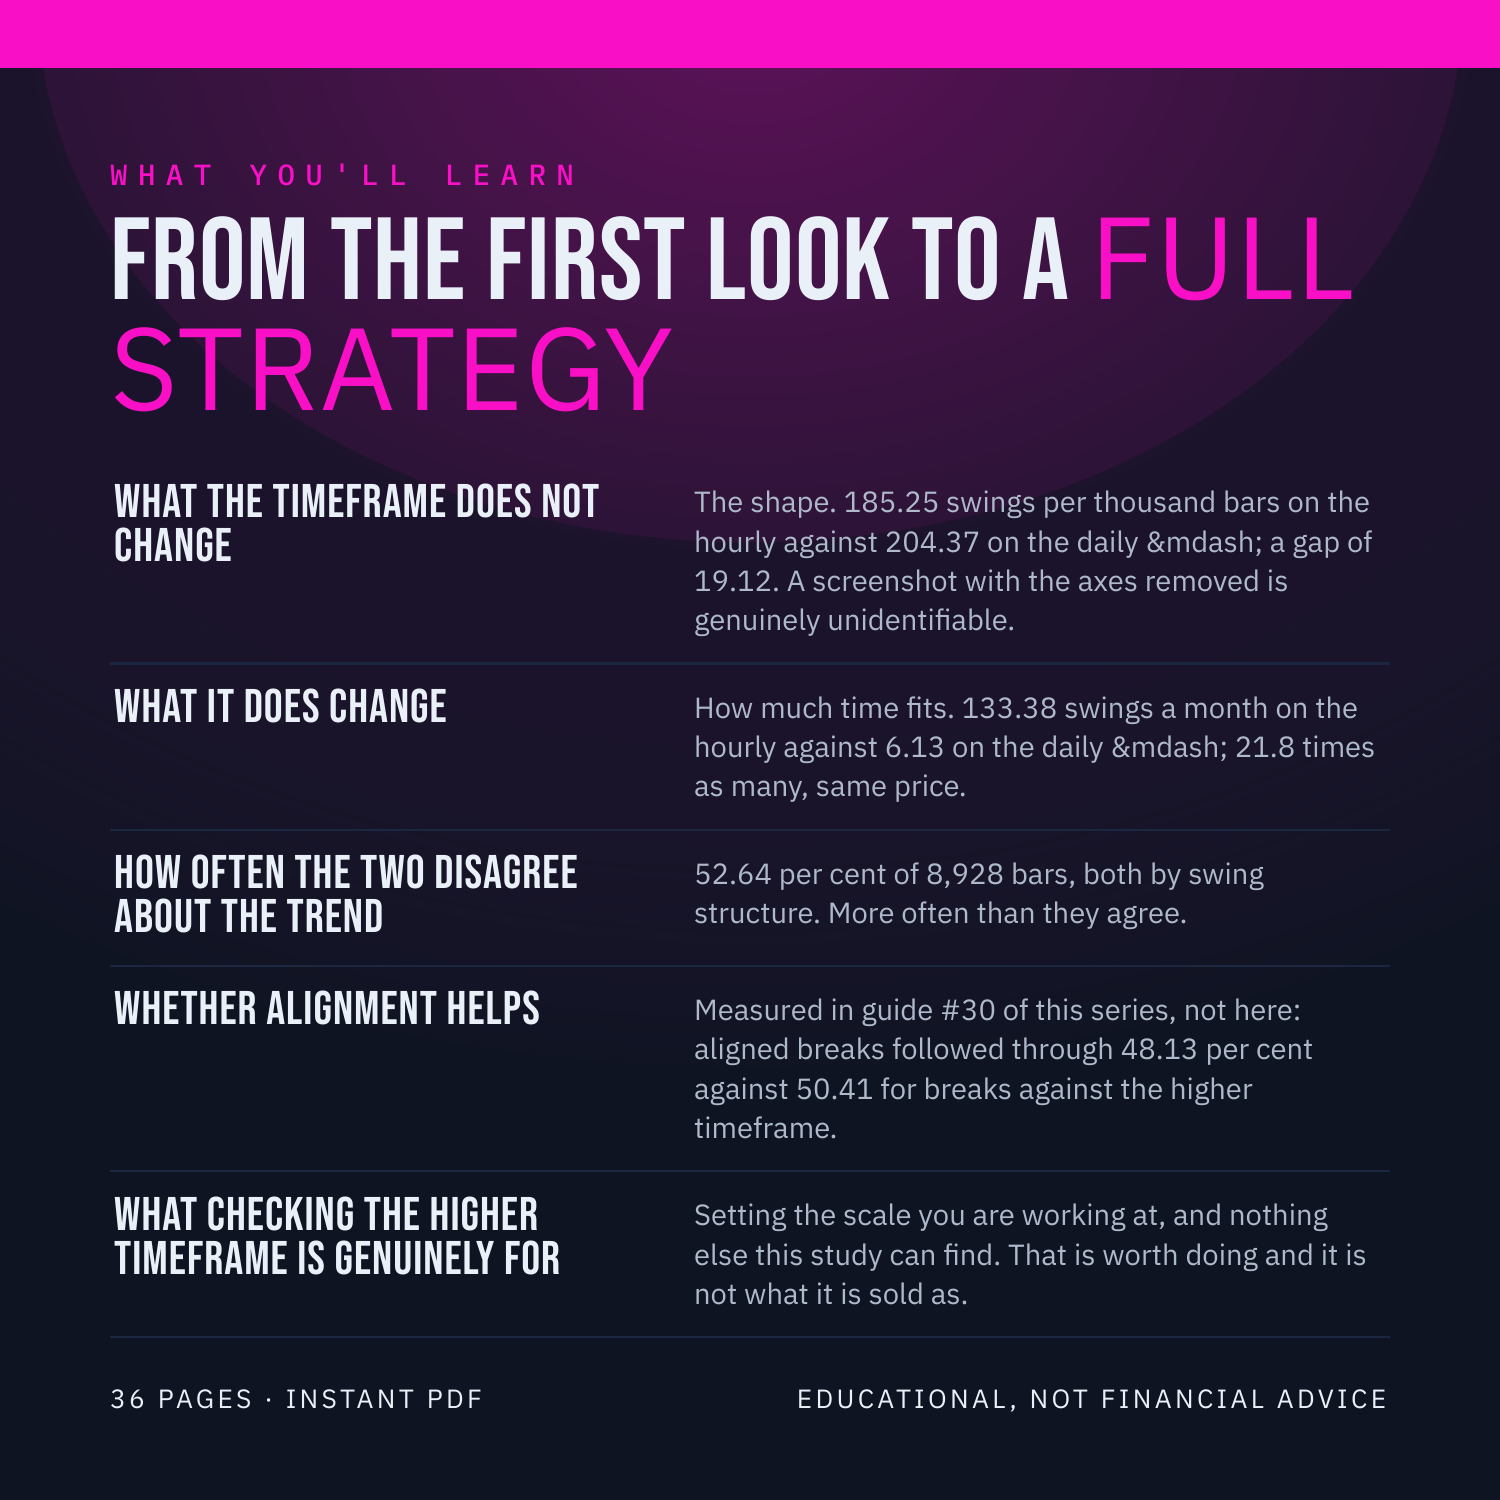
What the timeframe does NOT change - The shape. 185.25 swings per thousand bars on the hourly against 204.37 on the daily, a gap of 19.12. A screenshot with the axes removed is genuinely unidentifiable.
What it does change - How much time fits. 133.38 swings a month on the hourly against 6.13 on the daily, 21.8 times as many, same price.
How often the two disagree about the trend - 52.64 per cent of 8,928 bars, both by swing structure. More often than they agree.
Whether alignment helps - Measured in guide #30 of this series, not here: aligned breaks followed through 48.13 per cent against 50.41 for breaks against the higher timeframe.
What checking the higher timeframe is genuinely for - Setting the scale you are working at, and nothing else this study can find. That is worth doing and it is not what it is sold as.
WHAT YOU'LL BE ABLE TO DO
Say what changes and what does not when you switch timeframe.
Stop treating the higher timeframe as more real.
Expect disagreement rather than being surprised by it.
Read a self-similar chart without being fooled by the axis.
Choose a timeframe for a stated reason.
AN HONEST NOTE
A higher timeframe is a clue, not a crystal ball. It describes what price has already done. This guide contains no win-rates, no backtest results and no promises about what you will make, because nobody can verify those and you should not trust anyone who prints them. What it hands you instead is a set of rules you can test yourself on TradingView in an afternoon. Educational, not financial advice.
Instant download. 36 pages, PDF.