


Financial Analytics Dashboard for startup,Business and more
VERCEL PREVIEW LINK : https://financila.vercel.app/
https://www.youtube.com/channel/UCaKEzIXysxA12twU2g-Cy1g
HOW TO OPEN FILE
its zip by 7 zip software use that or any
1 right click open archiever
2 in 7zip folder wil open click
3 copy files and paste in other desired folders of your
4 run index.html by double click to open in browser and enjoy opening folder in Vscode and any editor
Financila - Financial Analytics Dashboard Template
A premium, modern financial dashboard template built with vanilla HTML, CSS, and JavaScript. Perfect for tracking key financial metrics, profitability, cash flow, and business performance.
---
## 📋 Table of Contents
- [Features](#features)
- [Quick Start](#quick-start)
- [File Structure](#file-structure)
- [Customization Guide](#customization-guide)
- [Connecting Real Data](#connecting-real-data)
- [Chart Configuration](#chart-configuration)
- [Styling Guide](#styling-guide)
- [Pages Overview](#pages-overview)
- [Browser Support](#browser-support)
- [Support](#support)
---
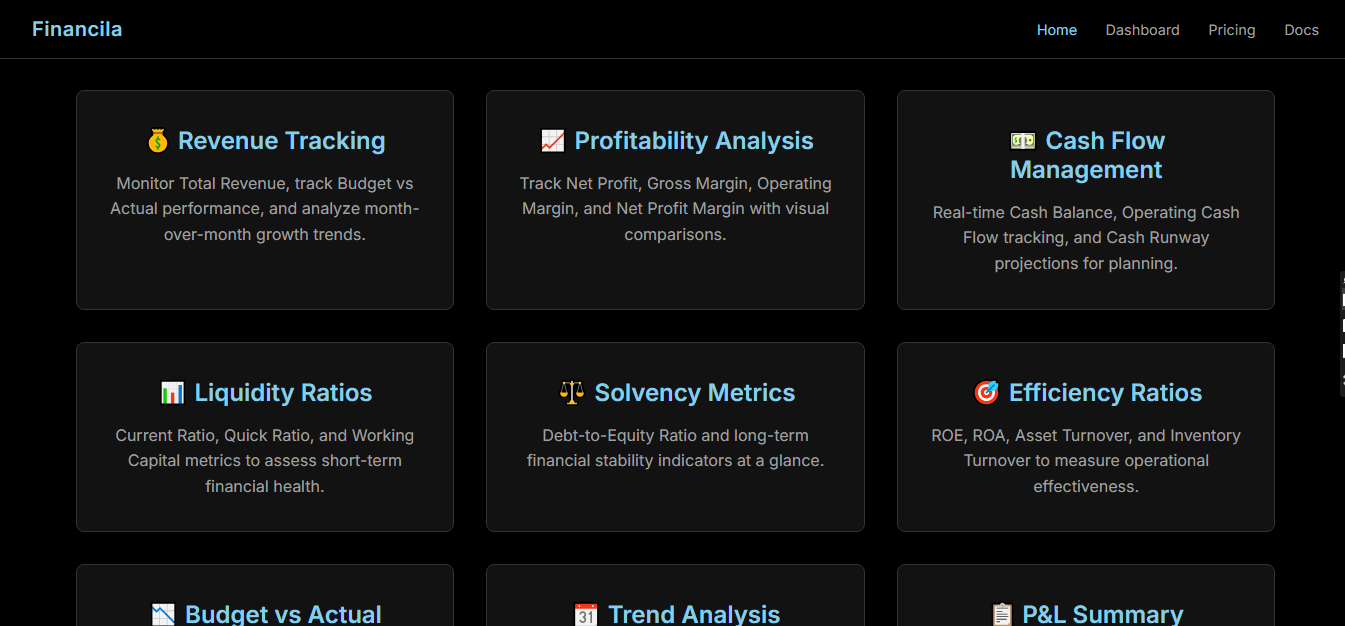
## ✨ Features
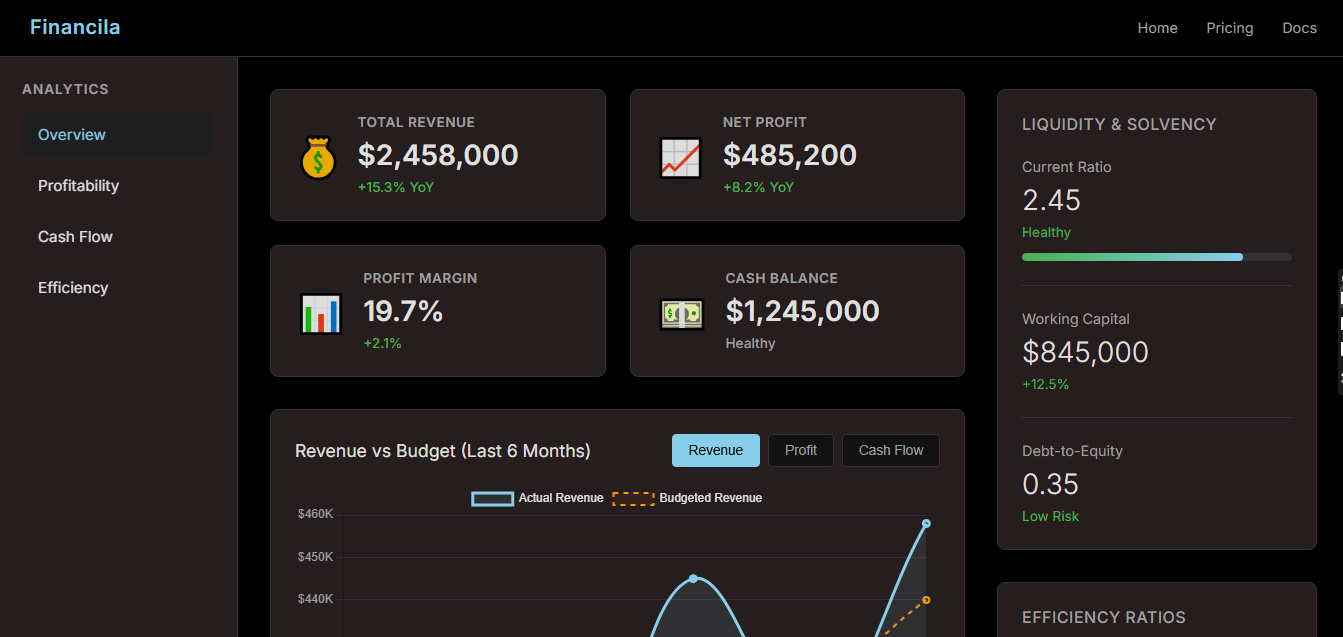
### Financial Metrics
- **Revenue Tracking** - Total revenue with YoY growth
- **Profitability** - Net profit, gross/operating/net margins
- **Cash Flow** - Cash balance, operating cash flow, runway projections
- **Liquidity Ratios** - Current ratio, working capital, debt-to-equity
- **Efficiency Ratios** - ROE, ROA, asset turnover
### Dashboard Views
- **Overview** - High-level financial summary
- **Profitability** - Margin comparisons and revenue mix
- **Cash Flow** - Cash flow statement and balance trends
- **Efficiency** - Turnover ratios and working capital
### Technical Features
- Responsive design (mobile, tablet, desktop)
- Dark mode interface with pink accents
- Interactive Chart.js visualizations
- Budget vs Actual comparisons
- View switching with sidebar navigation
- Clean, minimalistic UI
---
## 🚀 Quick Start
1. **Extract the template** to your project folder
2. **Open `landing.html`** in your browser to view the landing page
3. **Click "View Dashboard"** to access the main dashboard
4. **Modify the mock data** in `app.js` to use your real data
### Running Locally
You can simply open the HTML files directly in your browser, or use a local server:
```bash
# Using Python
python -m http.server 8000
# Using Node.js (npx)
npx serve .
# Using VS Code
# Install "Live Server" extension and click "Go Live"
```
Then navigate to `http://localhost:8000/landing.html`
---
## 📁 File Structure
```
financila-dashboard/
├── index.html # Main dashboard page
├── landing.html # Marketing landing page
├── pricing.html # Pricing tiers page
├── settings.html # User settings page
├── profile.html # User profile page
├── README.md # This documentation
├── LICENSE # License information
├── main.css # All CSS styles
└── app.js # Dashboard logic & chart data
```
---
## 🎨 Customization Guide
### Changing Colors
Open `main.css` and modify the CSS variables in `:root`:
```css
:root {
--color-bg: #000000; /* Main background */
--color-surface: #121212; /* Card backgrounds */
--color-surface-pink: rgba(255, 192, 203, 0.15); /* Pink tint */
--color-text: #e0e0e0; /* Primary text */
--color-text-muted: #a0a0a0; /* Secondary text */
--color-accent: #87CEEB; /* Accent color (sky blue) */
--color-accent-hover: #5F9EA0; /* Accent hover state */
--color-border: #333333; /* Border color */
--color-success: #4caf50; /* Positive values */
--color-warning: #ff9800; /* Warning indicators */
--color-danger: #f44336; /* Negative values */
}
```
### Changing the Logo
In each HTML file, find and replace:
```html
<div class="logo">Financila</div>
```
Replace `Financila` with your company name.
### Updating Navigation Links
Navigation is in the `<header>` section of each HTML file:
```html
<nav class="nav">
<a href="landing.html">Home</a>
<a href="index.html">Dashboard</a>
<a href="pricing.html">Pricing</a>
<a href="#">Contact</a>
</nav>
```
---
## 🔌 Connecting Real Data
### Step 1: Locate the Data Object
Open `app.js` and find the `viewData` object (around line 20):
```javascript
const viewData = {
overview: {
charts: {
revenue: {
title: 'Revenue vs Budget (Last 6 Months)',
type: 'line',
data: {
labels: ['Jul', 'Aug', 'Sep', 'Oct', 'Nov', 'Dec'],
datasets: [{
label: 'Actual Revenue',
data: [385000, 420000, 395000, 445000, 410000, 458000], // ← Replace with real data
// ...
}]
}
}
}
}
};
```
### Step 2: Replace Mock Data with API Calls
Replace the static data with fetch calls:
```javascript
// Example: Fetching data from your API
async function loadFinancialData() {
try {
const response = await fetch('https://your-api.com/financial-data');
const data = await response.json();
// Update chart data
viewData.overview.charts.revenue.data.datasets[0].data = data.revenueActual;
viewData.overview.charts.revenue.data.datasets[1].data = data.revenueBudget;
// Re-render the chart
renderChart('revenue');
} catch (error) {
console.error('Failed to load data:', error);
}
}
// Call on page load
document.addEventListener('DOMContentLoaded', loadFinancialData);
```
### Step 3: Update KPI Cards
In `index.html`, find the metric cards and update values dynamically:
```html
<p class="metric-value" id="total-revenue">$2,458,000</p>
```
```javascript
// Update via JavaScript
document.getElementById('total-revenue').textContent = '$' + formatNumber(data.totalRevenue);
```
### Step 4: Update P&L Table
The P&L table in `index.html` can be populated dynamically:
```javascript
function updatePLTable(data) {
const tbody = document.querySelector('.data-table tbody');
tbody.innerHTML = data.map(row => `
<tr>
<td>${row.category}</td>
<td>${formatCurrency(row.actual)}</td>
<td>${formatCurrency(row.budget)}</td>
<td class="${row.variance >= 0 ? 'positive' : 'negative'}">
${formatCurrency(row.variance)}
</td>
</tr>
`).join('');
}
```
---
## 📊 Chart Configuration
Charts use [Chart.js](https://www.chartjs.org/). Each chart configuration includes:
```javascript
{
title: 'Chart Title',
type: 'line', // line, bar, doughnut, etc.
data: {
labels: ['Jan', 'Feb', 'Mar'],
datasets: [{
label: 'Dataset Name',
data: [100, 200, 300],
borderColor: '#87CEEB',
backgroundColor: 'rgba(135, 206, 235, 0.1)',
borderWidth: 3,
tension: 0.4, // Line smoothing
fill: true
}]
}
}
```
### Available Chart Types
- `line` - Trend lines
- `bar` - Comparisons
- `doughnut` - Proportions
- `pie` - Distribution
---
## 🎨 Styling Guide
### Adding New Metric Cards
```html
<div class="metric-card">
<div class="metric-icon">📈</div>
<div class="metric-content">
<h4>Metric Name</h4>
<p class="metric-value">$123,456</p>
<span class="metric-change positive">+10% YoY</span>
</div>
</div>
```
### Status Classes
- `.positive` - Green text for positive values
- `.negative` - Red text for negative values
- `.neutral` - Gray text for neutral values
### Button Styles
- `.cta-button` - Primary call-to-action
- `.pricing-btn` - Pricing card buttons
- `.action-btn` - Dashboard action buttons
- `.chart-btn` - Chart toggle buttons
---
## 📄 Pages Overview
| Page | Description |
|------|-------------|
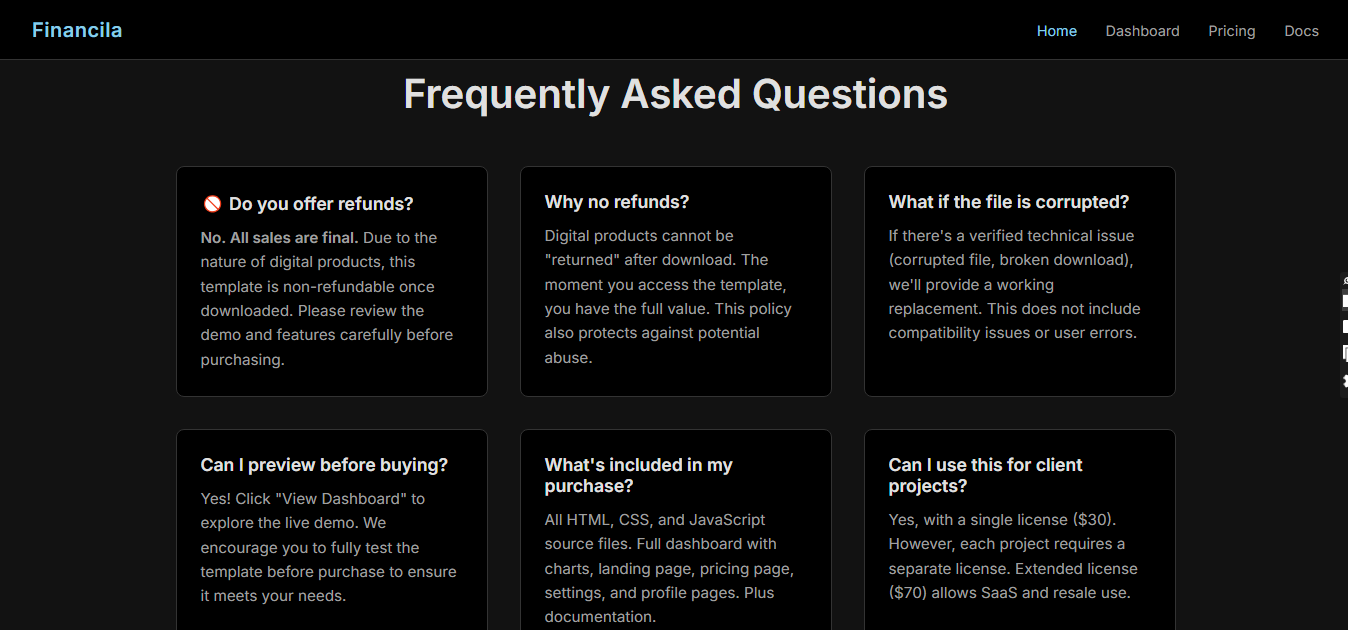
| `landing.html` | Marketing homepage with features and testimonials |
| `index.html` | Main financial dashboard with charts and KPIs |
| `pricing.html` | Three-tier pricing page (Free, Pro, Enterprise) |
| `settings.html` | Account settings form |
| `profile.html` | User profile page |
---
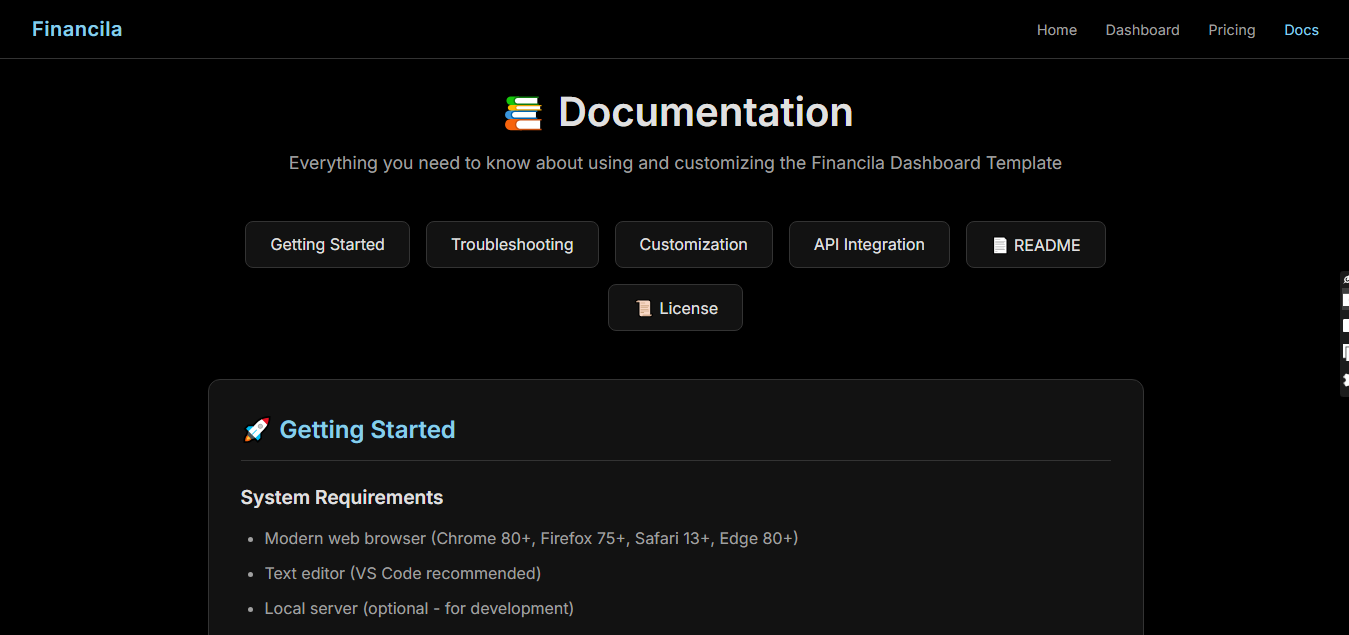
## 🌐 Browser Support
- Chrome 80+
- Firefox 75+
- Safari 13+
- Edge 80+
---
## 📞 Support
For questions, customization requests, or technical support:
- **Email**: support@financila.com
- **Documentation**: https://docs.financila.com
- **Updates**: Check for template updates on your purchase platform
---
## 📝 Changelog
### Version 1.0.0
- Initial release
- Financial dashboard with 4 views
- Budget vs Actual comparisons
- Responsive design
- Landing, pricing, settings, profile pages
---
**Thank you for purchasing Financila Dashboard Template!**
© 2025 Financila. All rights reserved.