






Fibonacci Retracement Explained — The Golden Pocket & Pullback Strategy
On Sale
$7.00
$7.00
Every trader asks the same thing in a pullback: "how far will it drop before the trend continues?"
Fibonacci retracement is how you answer it — and this visual guide shows you exactly how to use it.
📘 What It Is
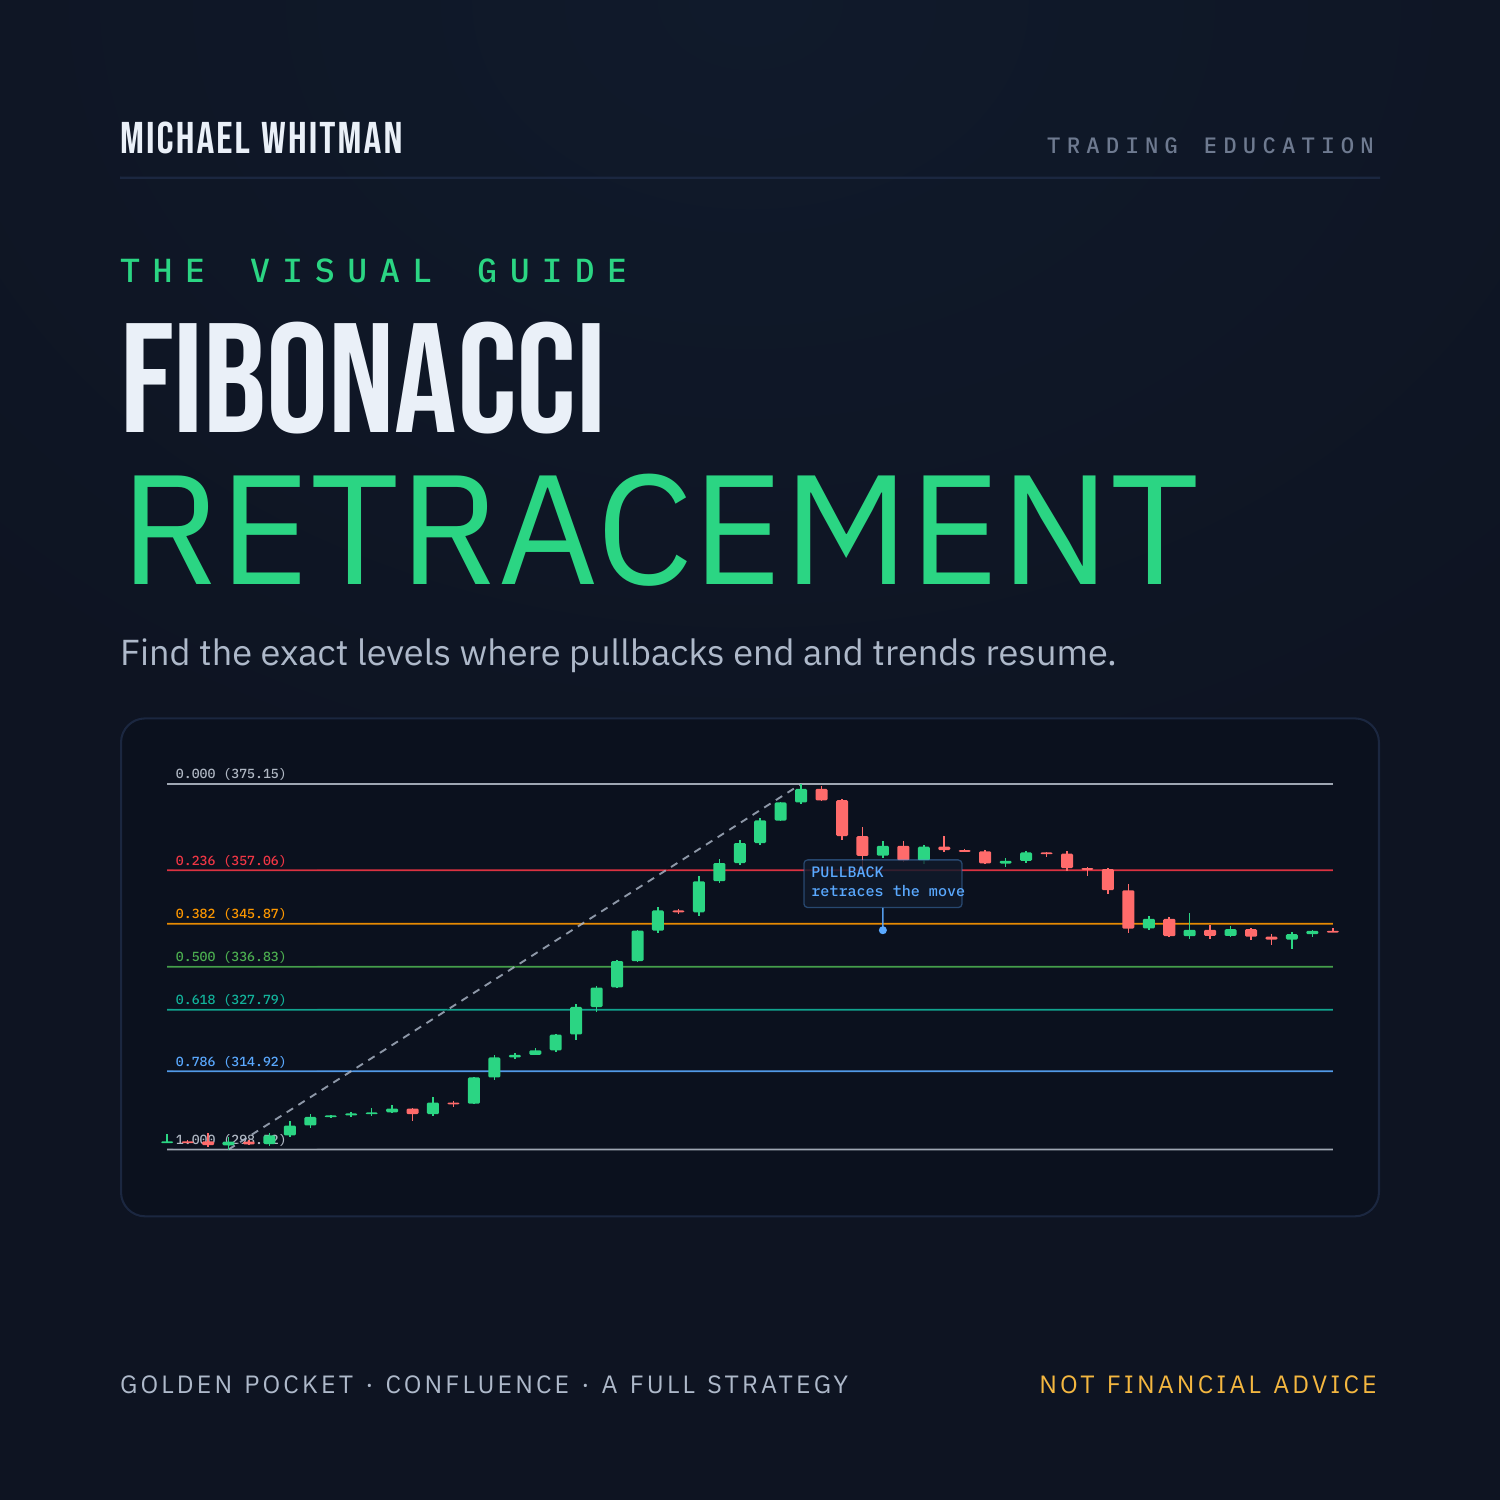
Fibonacci Retracement Explained — a clean, beginner-friendly PDF that teaches the tool visually.
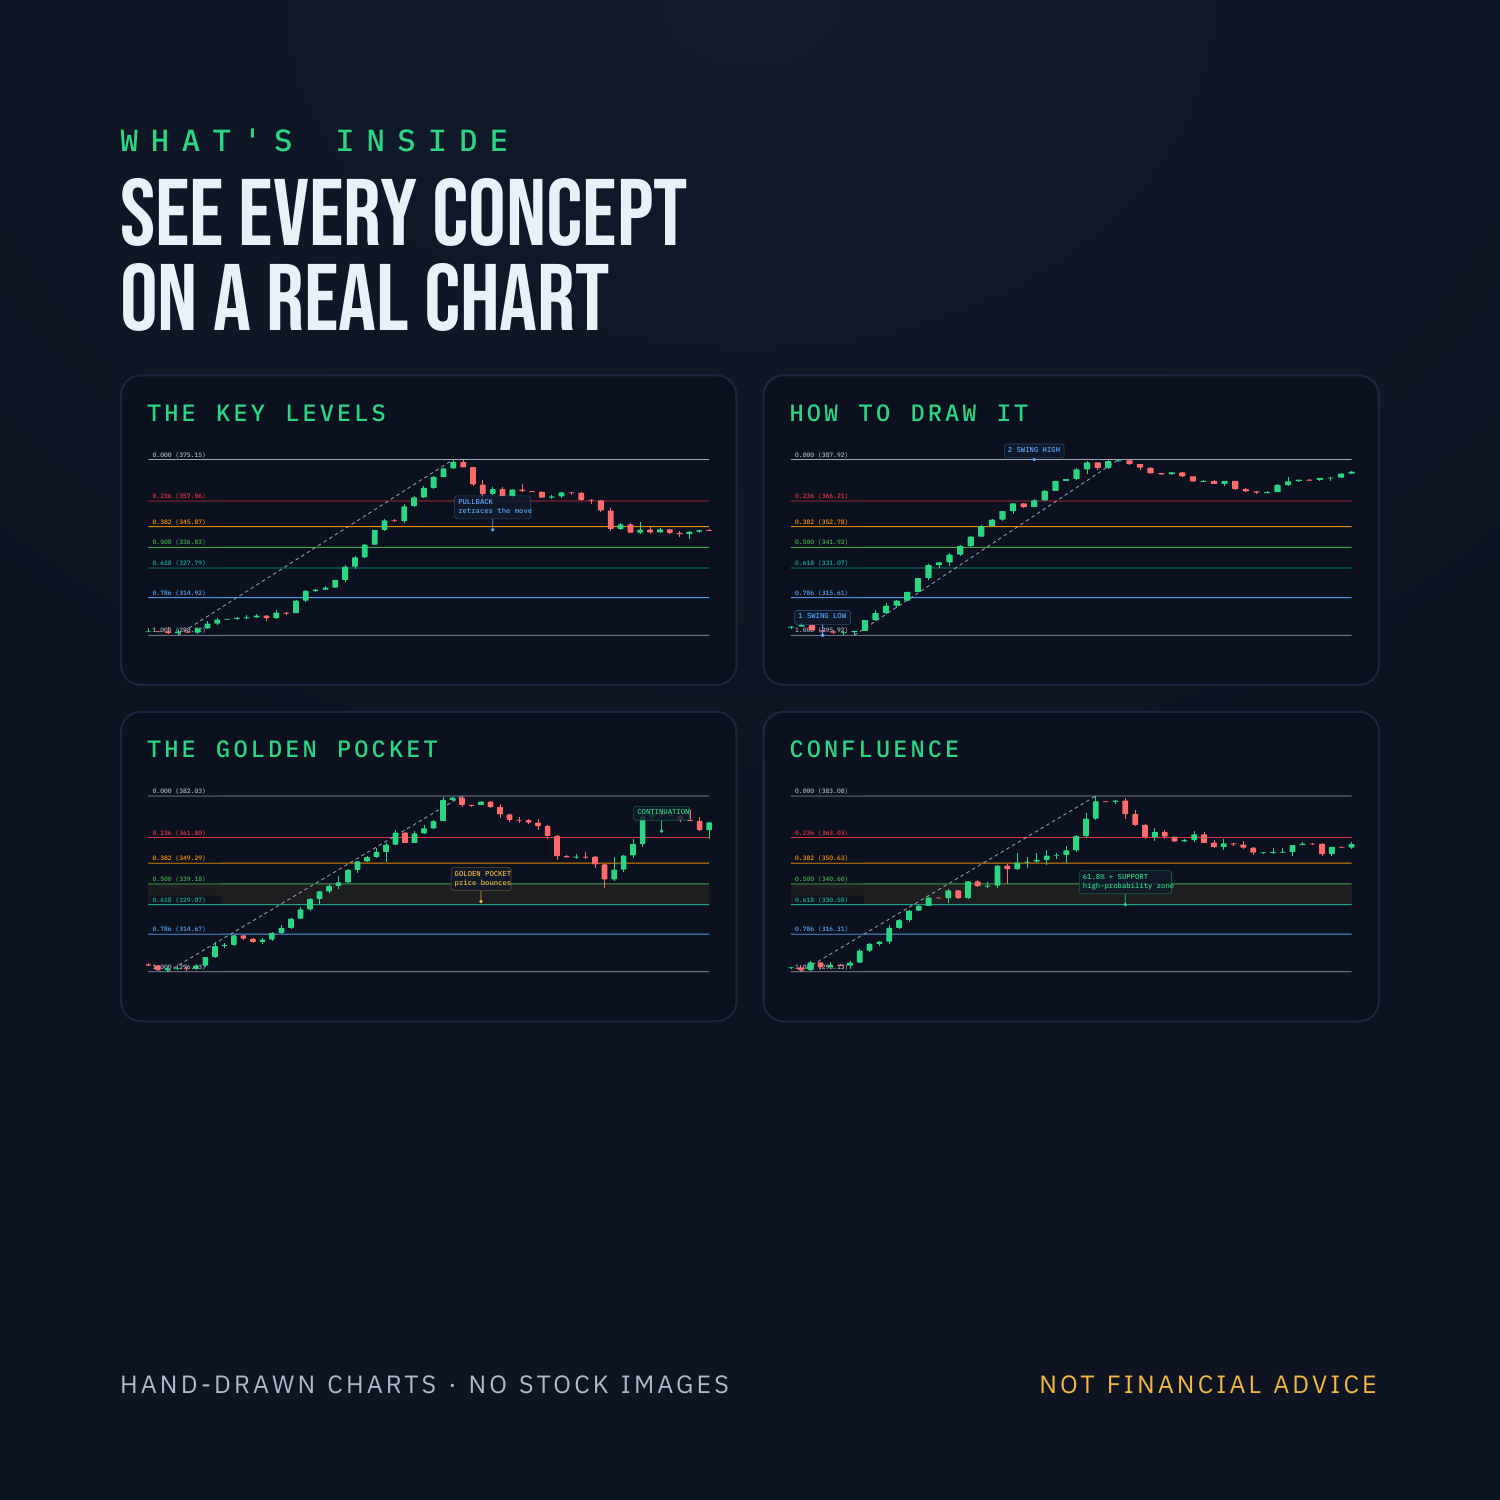
- Every concept shown on a real, hand-drawn chart
- Ends with a step-by-step strategy + printable checklist
📂 What's Inside
- The key levels — what 23.6 / 38.2 / 50 / 61.8 / 78.6% actually mean
- How to draw it — swing low to high (and high to low) the right way
- The golden pocket — the 50–61.8% zone where the pros enter
- Confluence — stack fibs with support & structure for a real edge
- The #1 mistake — why forced Fibs fail, and how to avoid it
- Full strategy — step-by-step pullback entry + pre-trade checklist
✅ What You'll Be Able To Do
- Draw Fibonacci retracements correctly on any chart
- Spot the golden pocket and time trend-continuation entries
- Filter weak setups using confluence
- Follow a simple, testable strategy with defined risk
⚠️ The Honest Note
Fibonacci levels are zones where pullbacks often end — they're clues, not a crystal ball. No indicator predicts the future.
Educational only, not financial advice.
📦 What You Get
- Instant PDF download — 10 pages, clean visual design
- Works on any device — yours forever
- Pairs with: RSI, MACD, EMA, Stochastic, Bollinger Bands guides + the Pro Trading Journal