


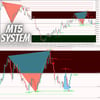
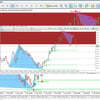

Modified MT5 Fully Automated Technical Analysis System
On Sale
$74.99
$74.99
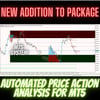
2021 M T 5 S Y S T E M A U T O M A T E D T E C H N I C A L A N A L Y S I S
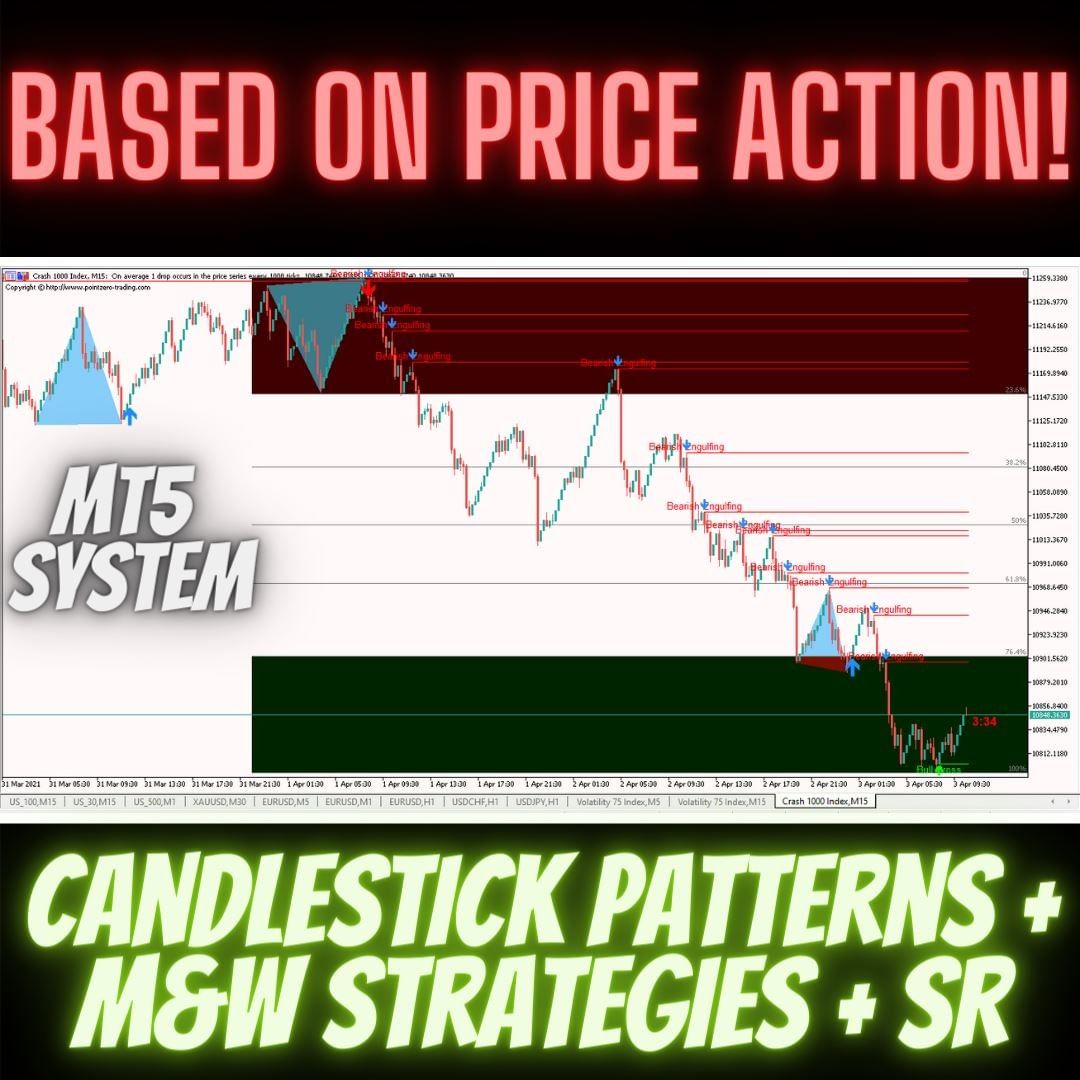
This system consists of different technical analysis tools sold separately at a much higher price than the overall price of the complete combined system you are about to get here, saving you more than $300!!
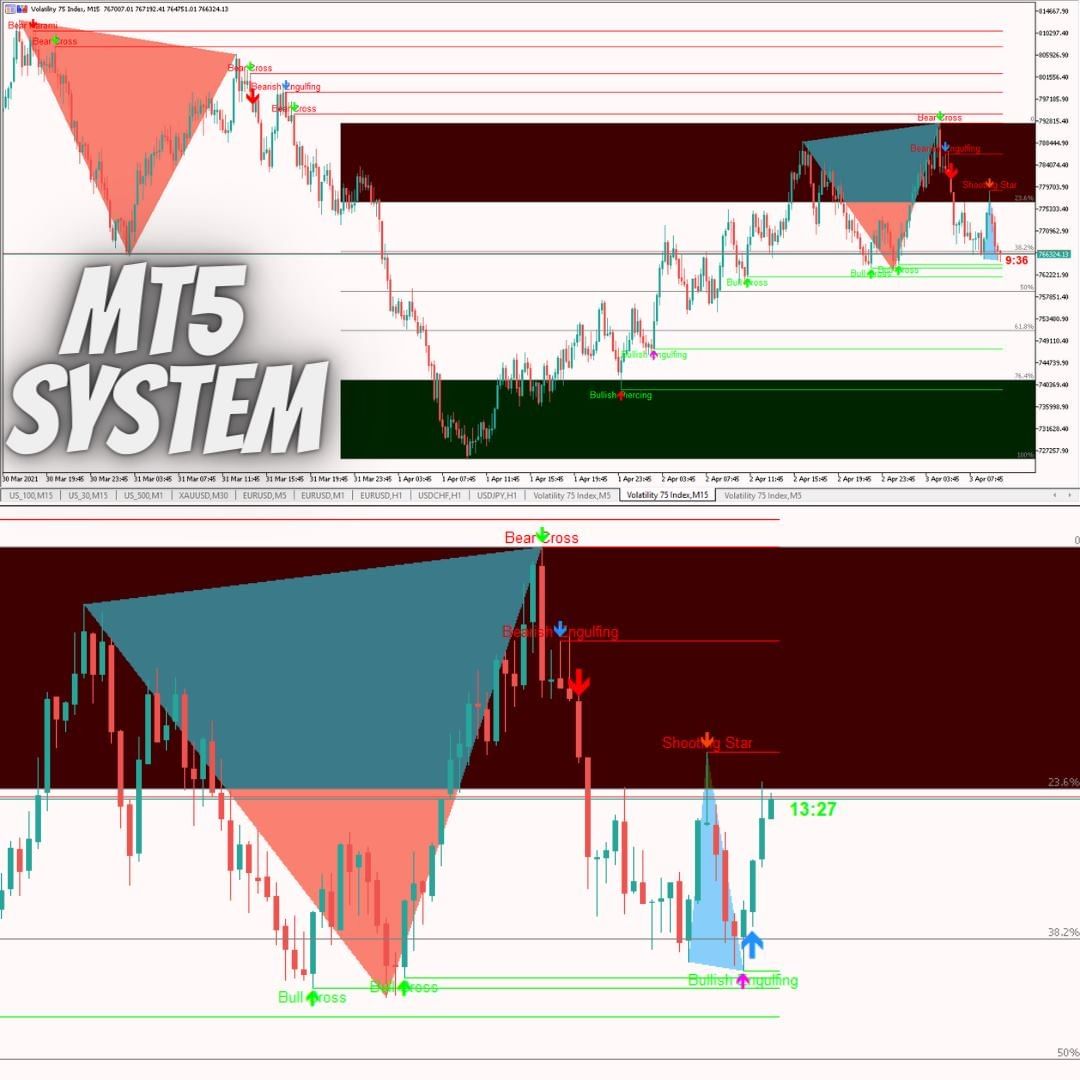
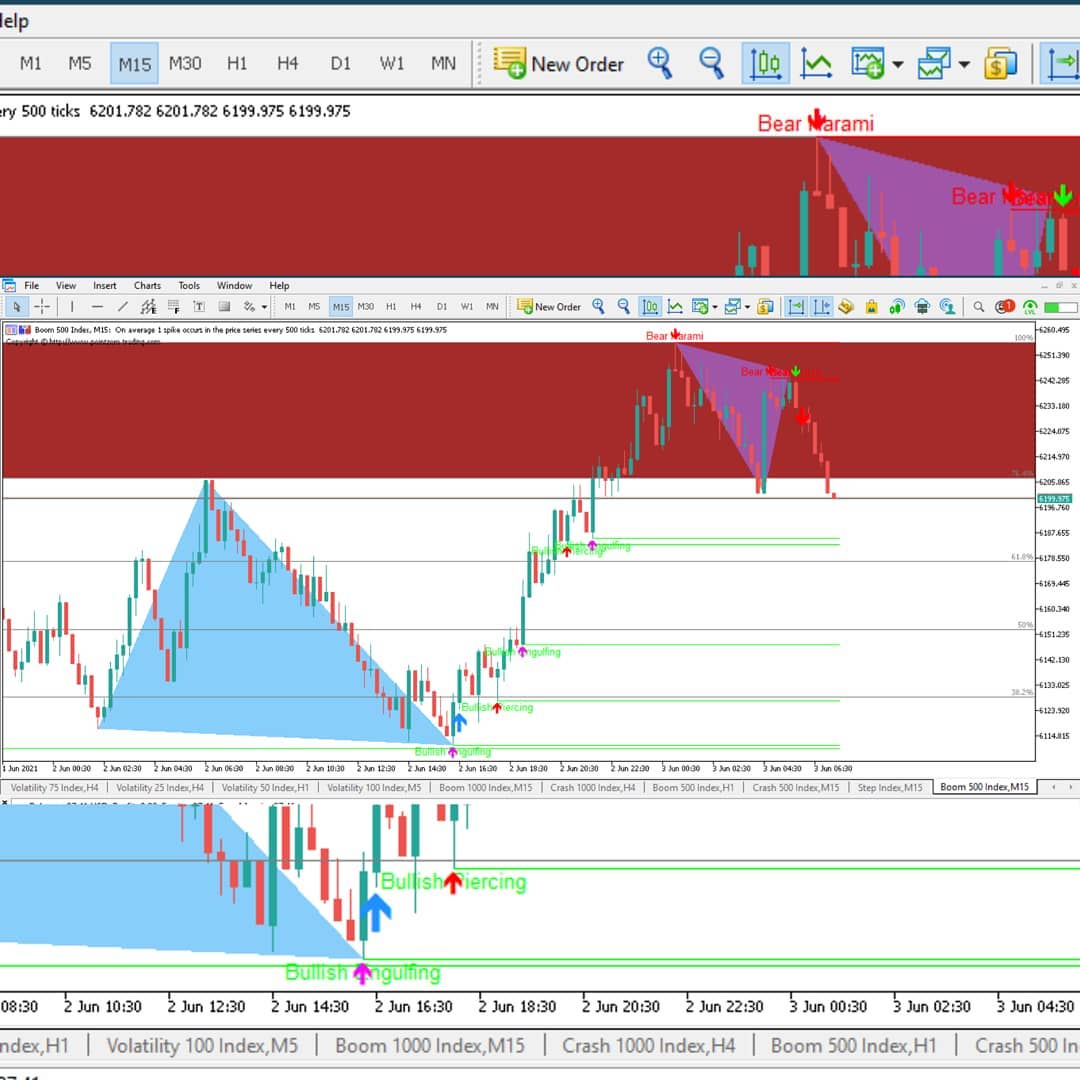
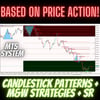
1) Candlestick Patterns
The Candlestick Patterns indicator recognizes over 30 Japanese Candlestick Patterns and highlights them beautifully on the chart. It is simply one of those indicators price action traders can't live without. Boost your technical analysis overnight Detect Japanese candlestick patterns easily Trade reliable and universal reversal patterns Hop onto established trends safely using continuation patterns The indicator is non-repainting and implements alerts
2) Supply Demand
The Supply/Demand indicator analyzes past price action to anticipate buying and selling pressure in the market: it does so by looking back into the past and analyzing price peaks and valleys around the current price. It is a state-of-the-art confirmation indicator.
Predict buying and selling pressure in the market
Avoid getting caught in buying selling frenzies
No settings and no optimization needed
The indicator works in all timeframes
Extremely easy to use
3) Triple Top / Bottom
The triple top and bottom pattern is a type of chart pattern used in to predict the reversal of trend. The pattern occurs when the price creates three peaks at nearly the same price level. The bounce off the resistance near the third peak is a clear indication that buying interest is becoming exhausted, which indicates that a reversal is about to occur.
Clear trading signals
Customizable colors and sizes
Implements performance statistics
Customizable Fibonacci retracement levels
Displays suitable stop-loss and take-profit levels
The indicator can be used to find continuation or reversal patterns
It implements email/sound/visual alerts
These patterns can expand, and the indicator follows the pattern by repainting. However, the indicator implements a twist to make it easier to trade: it waits for a Donchian breakout in the right direction before signaling the trade, making its signals very reliable and mostly non-repainting.
4) Double Top / Bottom
A double top or bottom is a chart pattern, characterized by two consecutive peaks or valleys in price, that signals a potential price reversal. Efficient reversals take place after a prolonged trend. This price pattern is more reliable on higher timeframes.
Clear trading signals
Customizable colors and sizes
Implements performance statistics
It displays suitable stop-loss and take-profit levels
It implements email/sound/visual alerts
These patterns can expand, and the indicator follows the pattern by repainting. However, the indicator implements a twist to make it easier to trade: it waits for a Donchian breakout in the right direction before signaling the trade, making its signals very reliable and mostly non repainting.
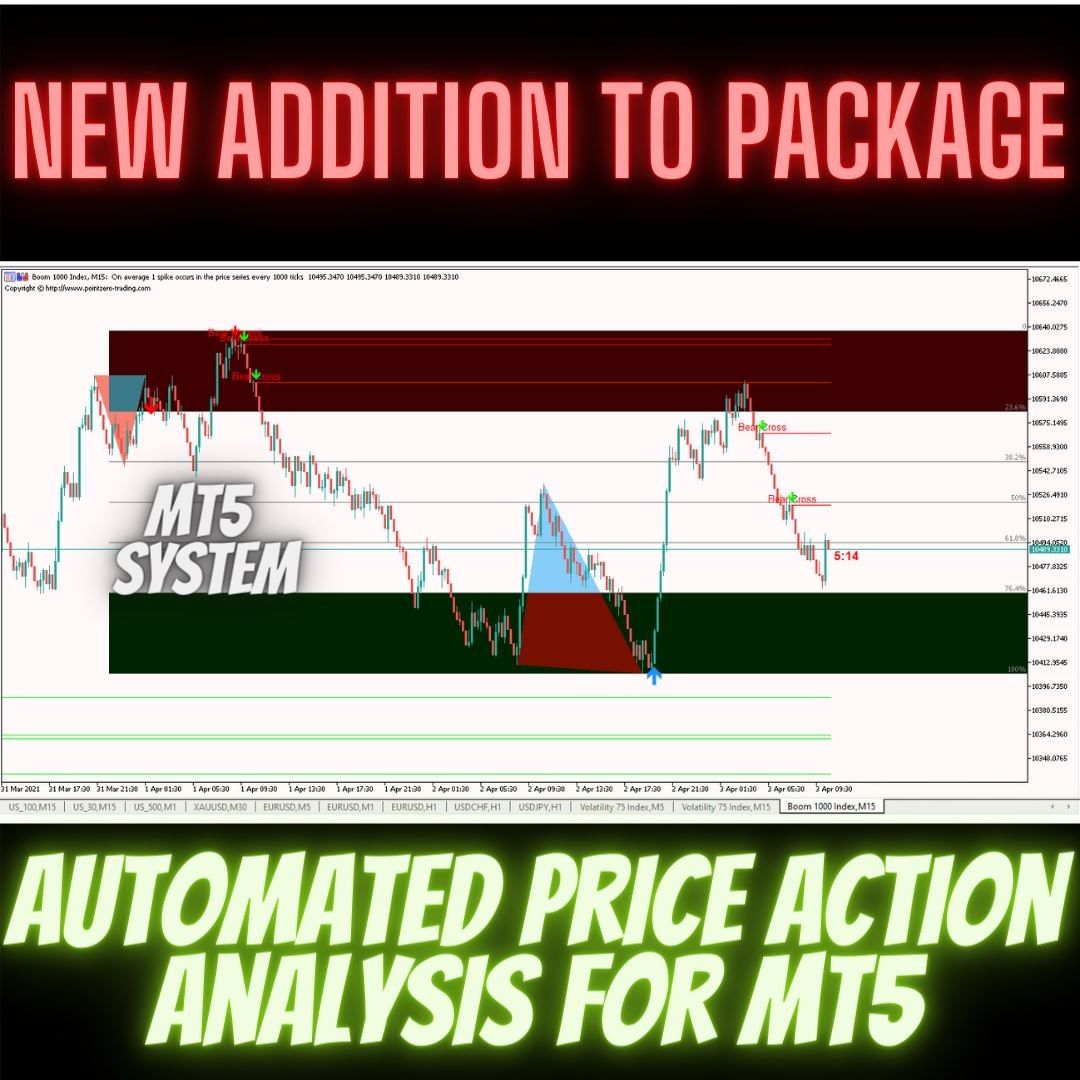
5) ABCD Retracement
This indicator finds AB=CD retracement patterns. The AB=CD Retracement pattern is a 4-point price structure where the initial price segment is partially retraced and followed by an equidistant move from the completion of the pullback, and is the basic foundation for all harmonic patterns.
Find harmonacci retracements easily
Learn the basics of harmonacci patterns
Useful to find cheap and expensive zones
Customizable AC and BD ratios (for purists)
t displays SL and TP levels based on CD fibo levels
It implements visual/sound/push/mail alerts
AB=CD Retracements can expand and repaint quite a bit. To make things easier this indicator implements a twist: it waits for a donchian breakout in the right direction before signaling the trade. The end result is an otherwise repainting indicator with a very reliable trading signal. The donchian breakout period is entered as an input.
Bullish retracements are blue
Bearish retracements are red
Kindly note that price patterns such as AB=CD can expand and the indicator must repaint to follow the expansion of the pattern. If the pattern repaints beyond the AC/BD/AB=CD ratios entered in the parameters, the pattern will disappear as it won't be valid anymore. To trade these patterns, please resort to the donchian breakout signal.
Technical Details
The indicator is evaluated every bar, not every tick.
The last point of the pattern repaints as the pattern expands.
You can have several indicators on the chart with different amplitudes.
An alert is displayed when the pattern forms and also when the breakout takes place.
A small percentage of trading signals can repaint. You can increase the breakout period.
6) Candle Timer
Last but definitely not least, this indicator displays the remaining time left for the current candle to close next to the current candle on the market, irrespective of the current timeframe in use. Furthermore, the timer is color-coded with green showing that the current candle is Bullish, Red showing Bearish then last 10 seconds timer changes color to Black to warn you of a new candle that's about to open as the current one closes.
How to use guide is included in PDF form with video training soon to be shared!
This system consists of different technical analysis tools sold separately at a much higher price than the overall price of the complete combined system you are about to get here, saving you more than $300!!
1) Candlestick Patterns
The Candlestick Patterns indicator recognizes over 30 Japanese Candlestick Patterns and highlights them beautifully on the chart. It is simply one of those indicators price action traders can't live without. Boost your technical analysis overnight Detect Japanese candlestick patterns easily Trade reliable and universal reversal patterns Hop onto established trends safely using continuation patterns The indicator is non-repainting and implements alerts
2) Supply Demand
The Supply/Demand indicator analyzes past price action to anticipate buying and selling pressure in the market: it does so by looking back into the past and analyzing price peaks and valleys around the current price. It is a state-of-the-art confirmation indicator.
Predict buying and selling pressure in the market
Avoid getting caught in buying selling frenzies
No settings and no optimization needed
The indicator works in all timeframes
Extremely easy to use
3) Triple Top / Bottom
The triple top and bottom pattern is a type of chart pattern used in to predict the reversal of trend. The pattern occurs when the price creates three peaks at nearly the same price level. The bounce off the resistance near the third peak is a clear indication that buying interest is becoming exhausted, which indicates that a reversal is about to occur.
Clear trading signals
Customizable colors and sizes
Implements performance statistics
Customizable Fibonacci retracement levels
Displays suitable stop-loss and take-profit levels
The indicator can be used to find continuation or reversal patterns
It implements email/sound/visual alerts
These patterns can expand, and the indicator follows the pattern by repainting. However, the indicator implements a twist to make it easier to trade: it waits for a Donchian breakout in the right direction before signaling the trade, making its signals very reliable and mostly non-repainting.
4) Double Top / Bottom
A double top or bottom is a chart pattern, characterized by two consecutive peaks or valleys in price, that signals a potential price reversal. Efficient reversals take place after a prolonged trend. This price pattern is more reliable on higher timeframes.
Clear trading signals
Customizable colors and sizes
Implements performance statistics
It displays suitable stop-loss and take-profit levels
It implements email/sound/visual alerts
These patterns can expand, and the indicator follows the pattern by repainting. However, the indicator implements a twist to make it easier to trade: it waits for a Donchian breakout in the right direction before signaling the trade, making its signals very reliable and mostly non repainting.
5) ABCD Retracement
This indicator finds AB=CD retracement patterns. The AB=CD Retracement pattern is a 4-point price structure where the initial price segment is partially retraced and followed by an equidistant move from the completion of the pullback, and is the basic foundation for all harmonic patterns.
Find harmonacci retracements easily
Learn the basics of harmonacci patterns
Useful to find cheap and expensive zones
Customizable AC and BD ratios (for purists)
t displays SL and TP levels based on CD fibo levels
It implements visual/sound/push/mail alerts
AB=CD Retracements can expand and repaint quite a bit. To make things easier this indicator implements a twist: it waits for a donchian breakout in the right direction before signaling the trade. The end result is an otherwise repainting indicator with a very reliable trading signal. The donchian breakout period is entered as an input.
Bullish retracements are blue
Bearish retracements are red
Kindly note that price patterns such as AB=CD can expand and the indicator must repaint to follow the expansion of the pattern. If the pattern repaints beyond the AC/BD/AB=CD ratios entered in the parameters, the pattern will disappear as it won't be valid anymore. To trade these patterns, please resort to the donchian breakout signal.
Technical Details
The indicator is evaluated every bar, not every tick.
The last point of the pattern repaints as the pattern expands.
You can have several indicators on the chart with different amplitudes.
An alert is displayed when the pattern forms and also when the breakout takes place.
A small percentage of trading signals can repaint. You can increase the breakout period.
6) Candle Timer
Last but definitely not least, this indicator displays the remaining time left for the current candle to close next to the current candle on the market, irrespective of the current timeframe in use. Furthermore, the timer is color-coded with green showing that the current candle is Bullish, Red showing Bearish then last 10 seconds timer changes color to Black to warn you of a new candle that's about to open as the current one closes.
How to use guide is included in PDF form with video training soon to be shared!