




Wedges Explained — Measured (PDF Guide)
You were taught that a falling wedge is bullish and a rising wedge is bearish, and then you went looking and found them everywhere, in both directions, at every scale. Part of that is real: the falling wedge genuinely is the most common shape measured in this whole wave. The rest is that nobody has ever written down what separates a wedge from a triangle, so half of what you are marking is the other shape.
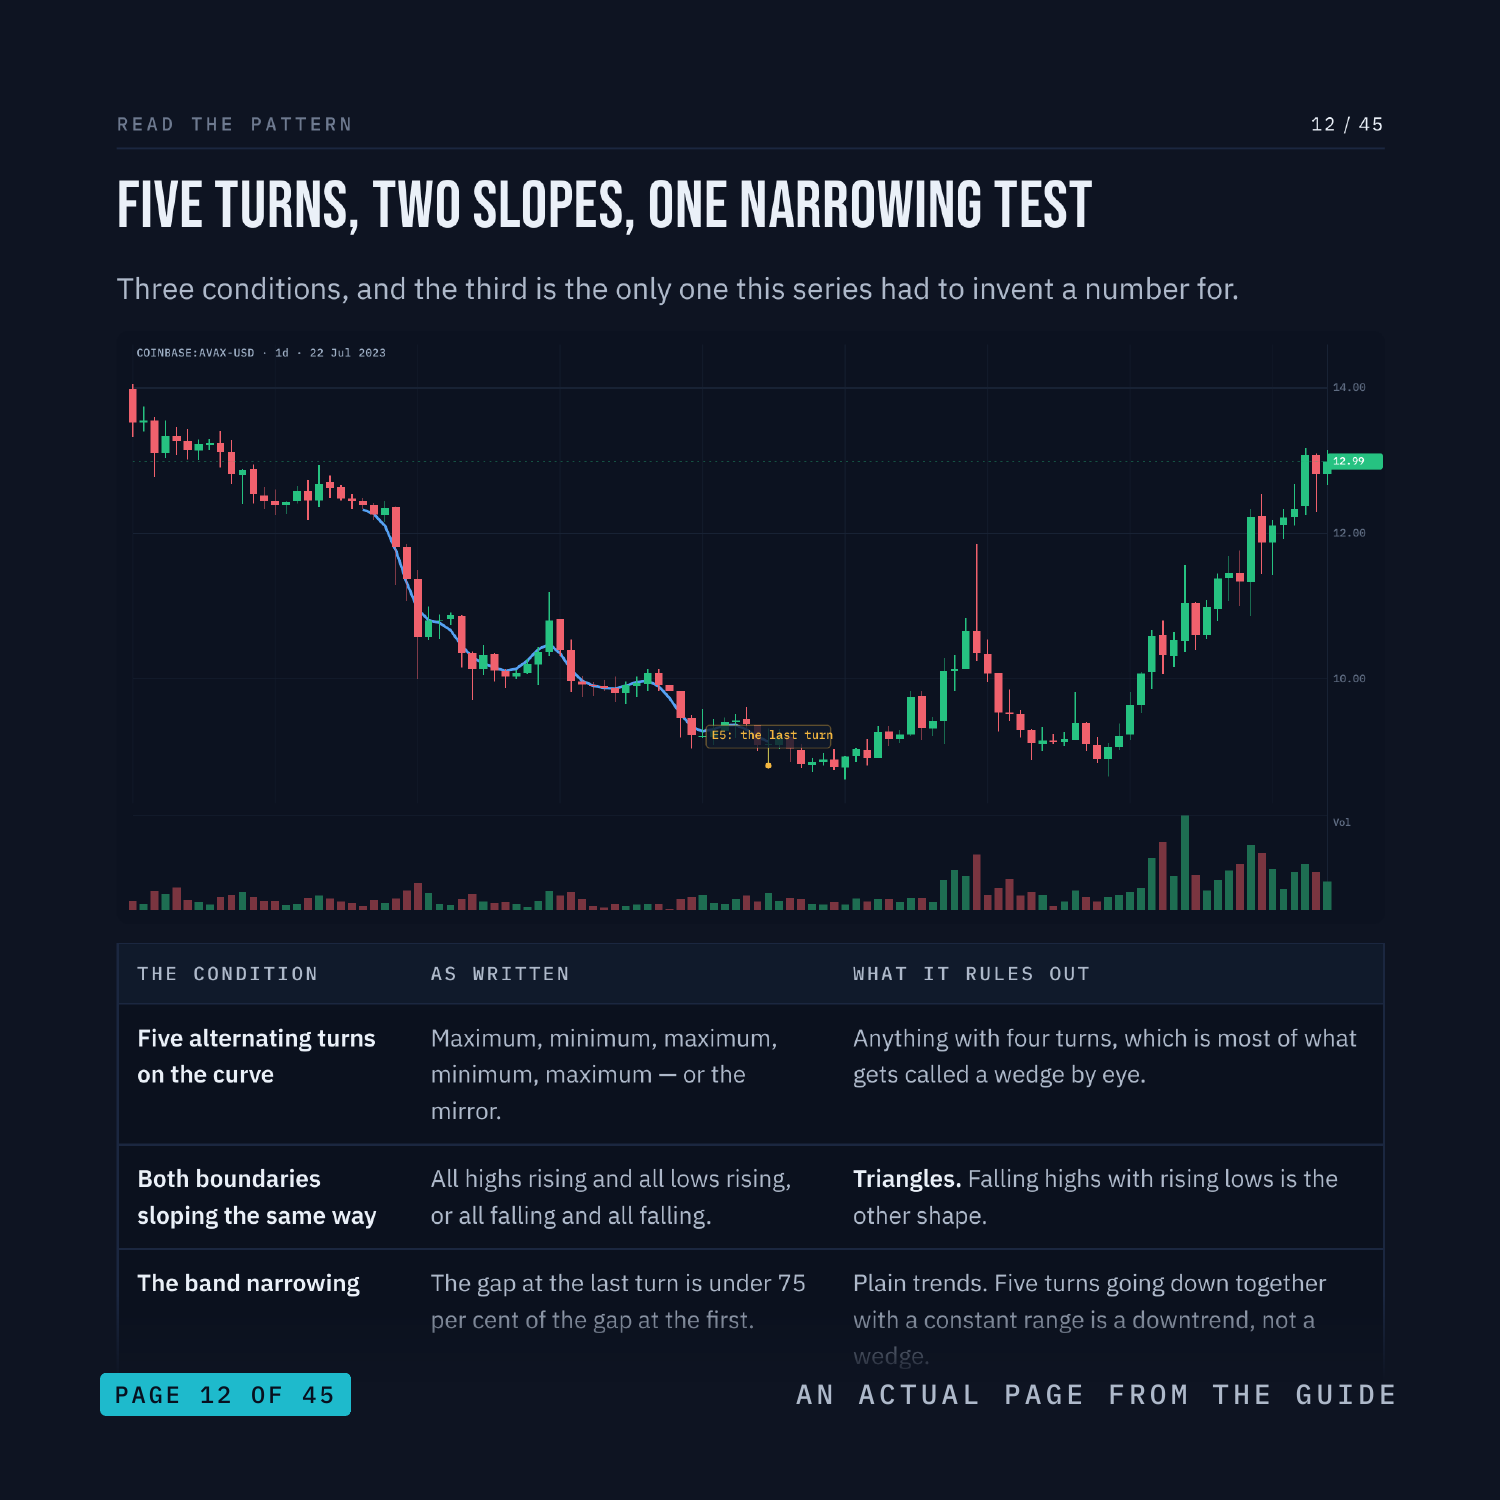
There is no published algorithmic definition of a wedge, so this series wrote one and prints it: five turns, both boundaries sloping the same way, and the vertical band narrowing to 75 per cent of its starting width. Across 35,944 bars that gives 693 falling wedges and 493 rising. Then it races them against a control and prints what came back. This is a 45-page PDF that teaches Wedges from the first thing you see on the screen through to a written strategy with an entry, a stop and an explicit rule for when the trade is wrong.
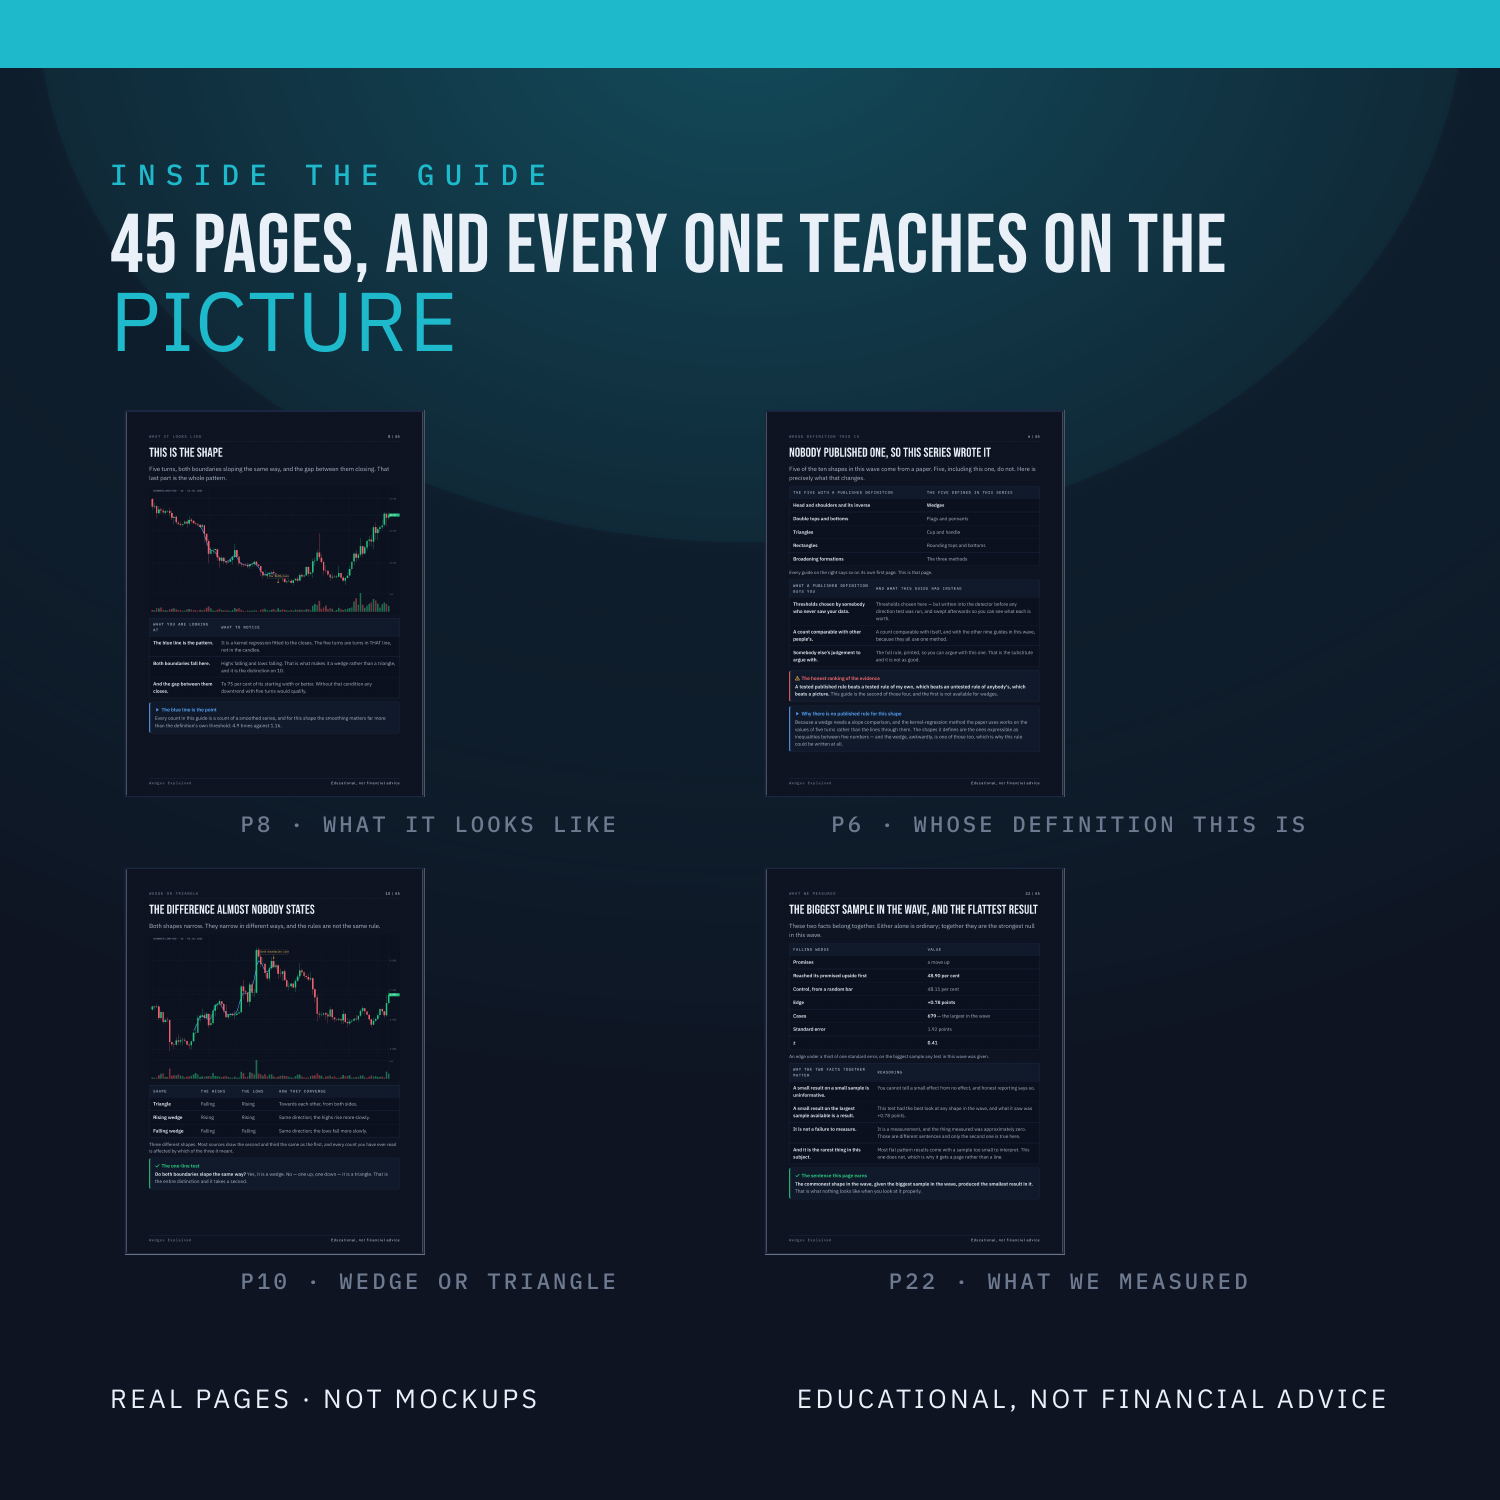
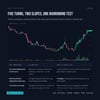
Nothing is taught underneath a chart. Every label sits on the candle, the line or the level it is describing, on real BTC, ETH, SOL and LINK charts, with the smoothed curve the detector actually saw drawn over the candles. There are three quizzes on real charts, each followed by the same chart re-shown annotated with the reasoning, plus faded practice pages where the first steps are filled in and you finish the rest.
WHAT'S INSIDE
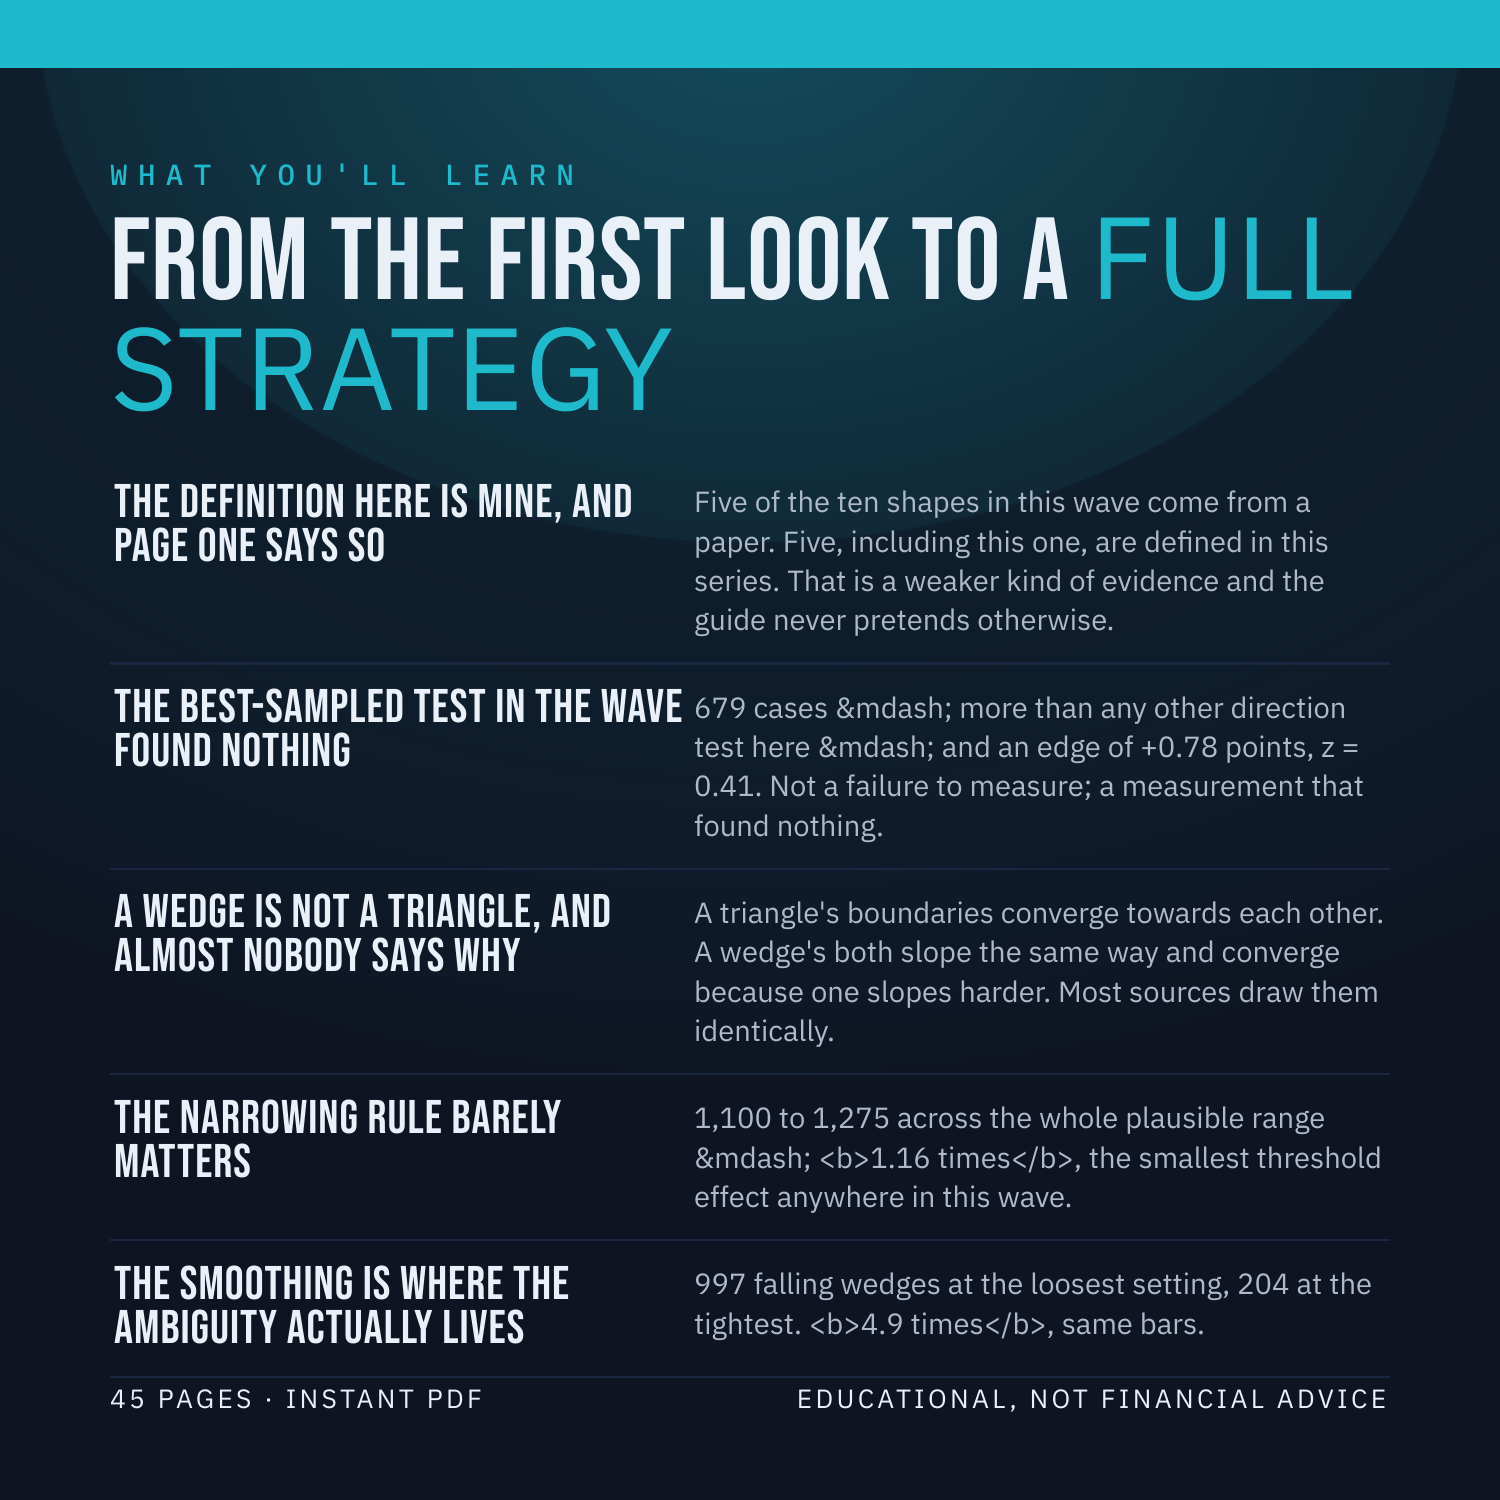
The definition here is mine, and page one says so - five of the ten shapes in this wave come from a paper. Five, including this one, are defined in this series. That is a weaker kind of evidence and the guide never pretends otherwise.
The best-sampled test in the wave found nothing - 679 cases, more than any other direction test here, and an edge of +0.78 points, z = 0.41. Not a failure to measure; a measurement that found nothing.
A wedge is not a triangle, and almost nobody says why - a triangle's boundaries converge towards each other. A wedge's both slope the same way and converge because one slopes harder. Most sources draw them identically.
The narrowing rule barely matters - 1,100 to 1,275 across the whole plausible range, 1.16 times, the smallest threshold effect anywhere in this wave.
The smoothing is where the ambiguity actually lives - 997 falling wedges at the loosest setting, 204 at the tightest. 4.9 times, same bars.
WHAT YOU'LL BE ABLE TO DO
Tell a wedge from a triangle by rule, not by how it looks.
Judge a definition somebody else wrote, including this one.
Read a large, flat result correctly - it is the strongest kind of null.
Say which of a pattern's two thresholds is actually doing the work.
Use the rising wedge as a check on the falling one.
AN HONEST NOTE
A wedge is a clue, not a crystal ball. It describes what price has already done. This guide contains no win-rates, no backtest results and no promises about what you will make, because nobody can verify those and you should not trust anyone who prints them. What it hands you instead is a set of rules you can test yourself on TradingView in an afternoon. Educational, not financial advice.
Instant download. 45 pages, PDF.