










Purge vs Breakout Log
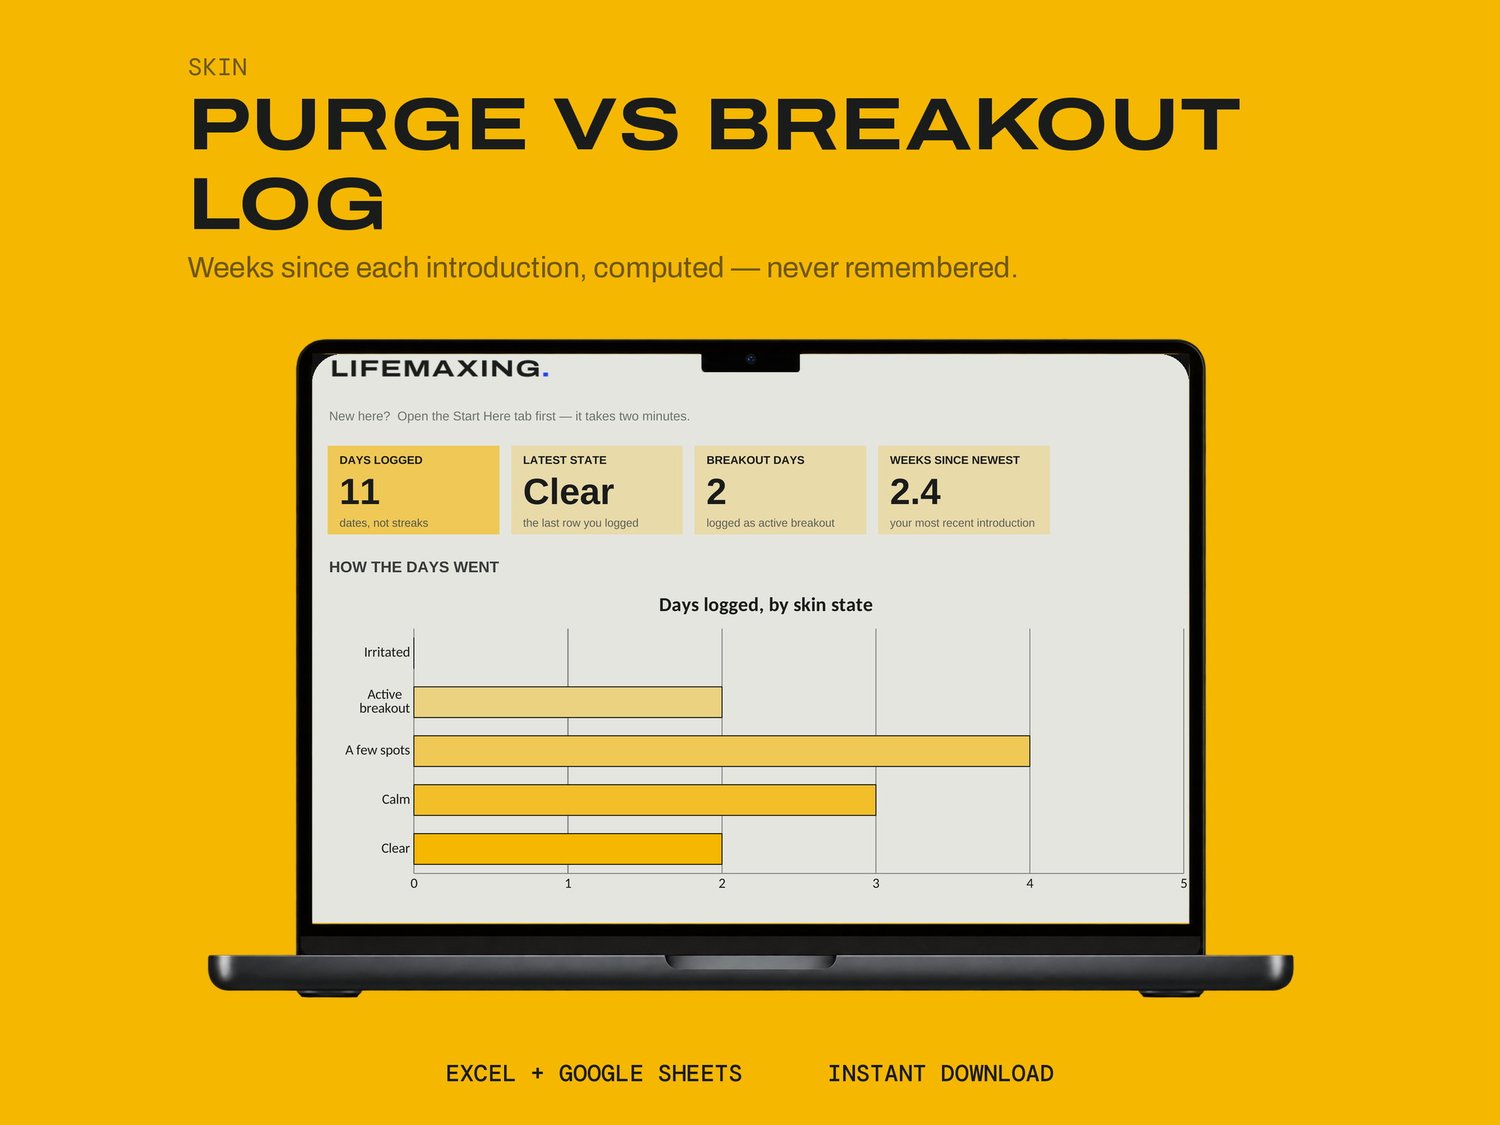
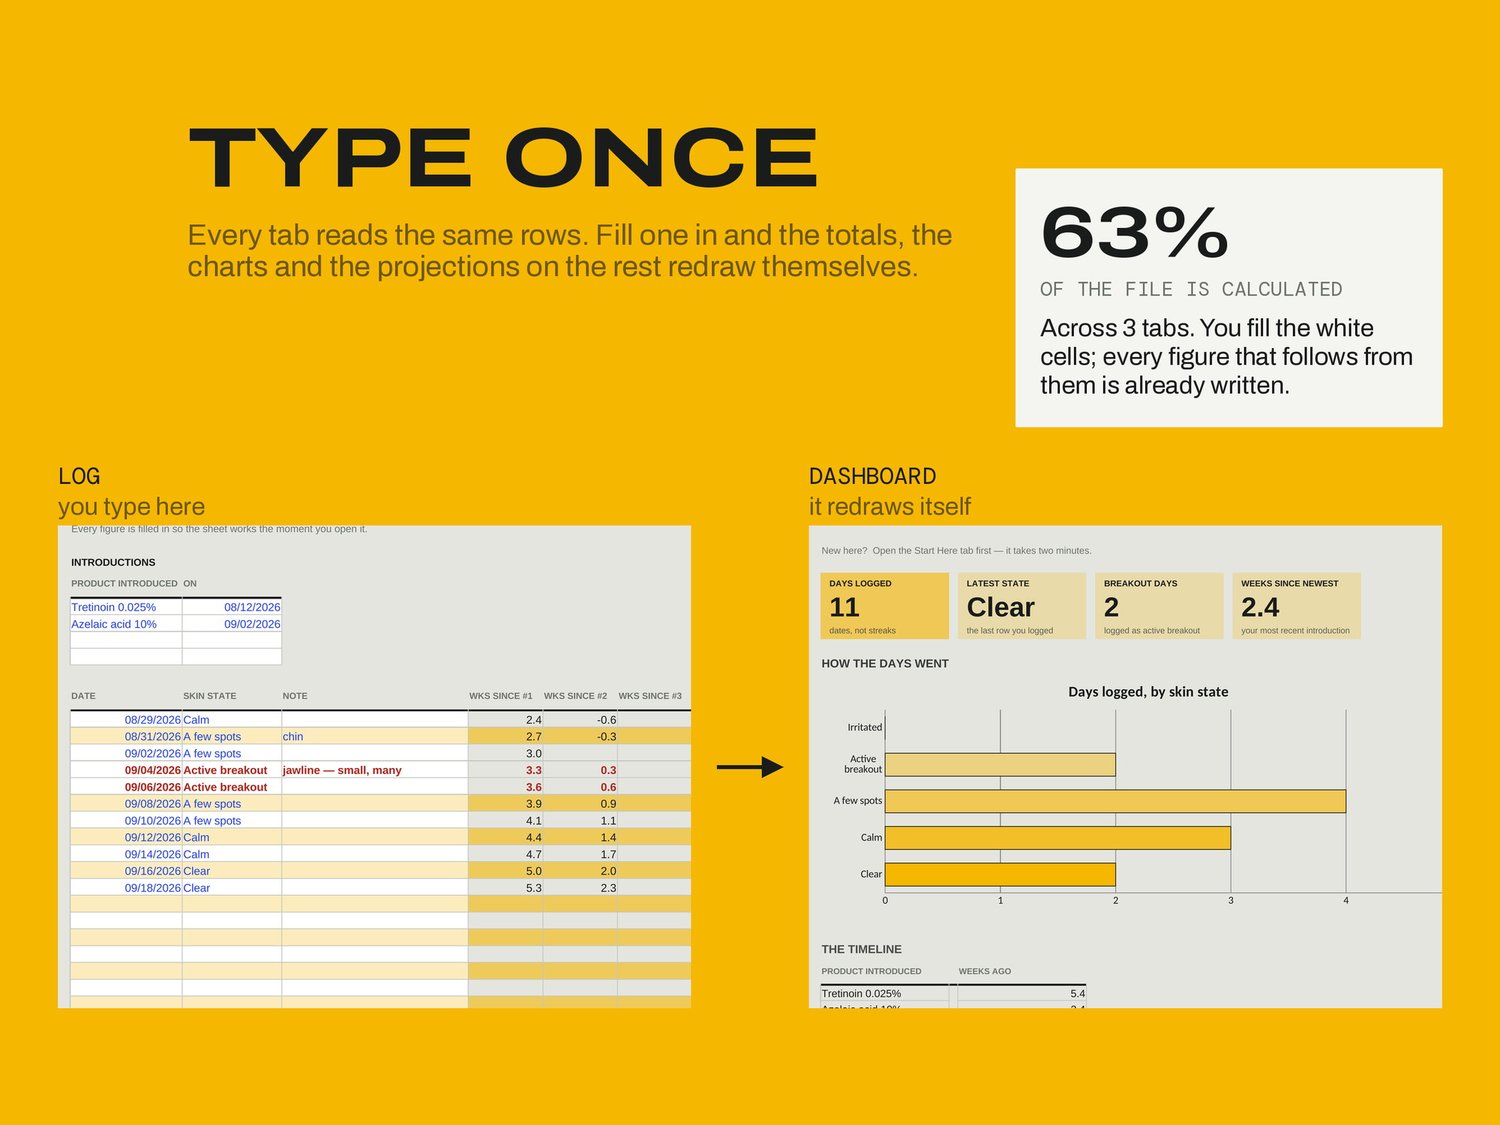
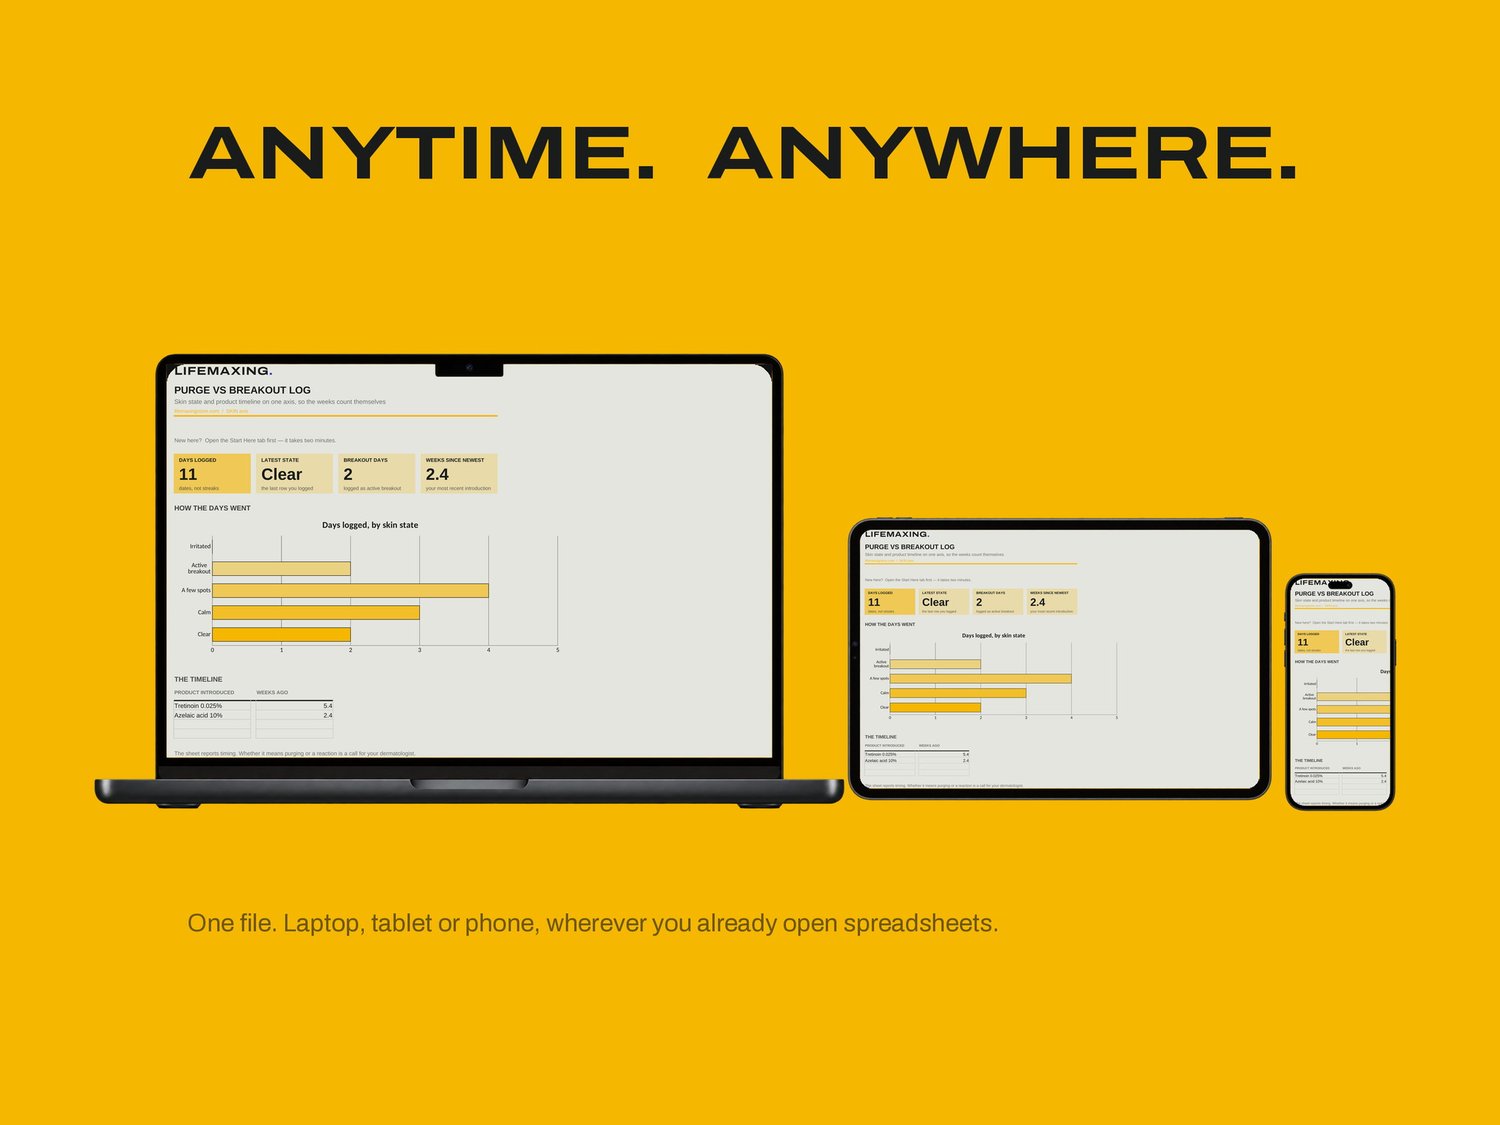
A daily skin log and a product-introduction timeline on the same axis, so the weeks count themselves.
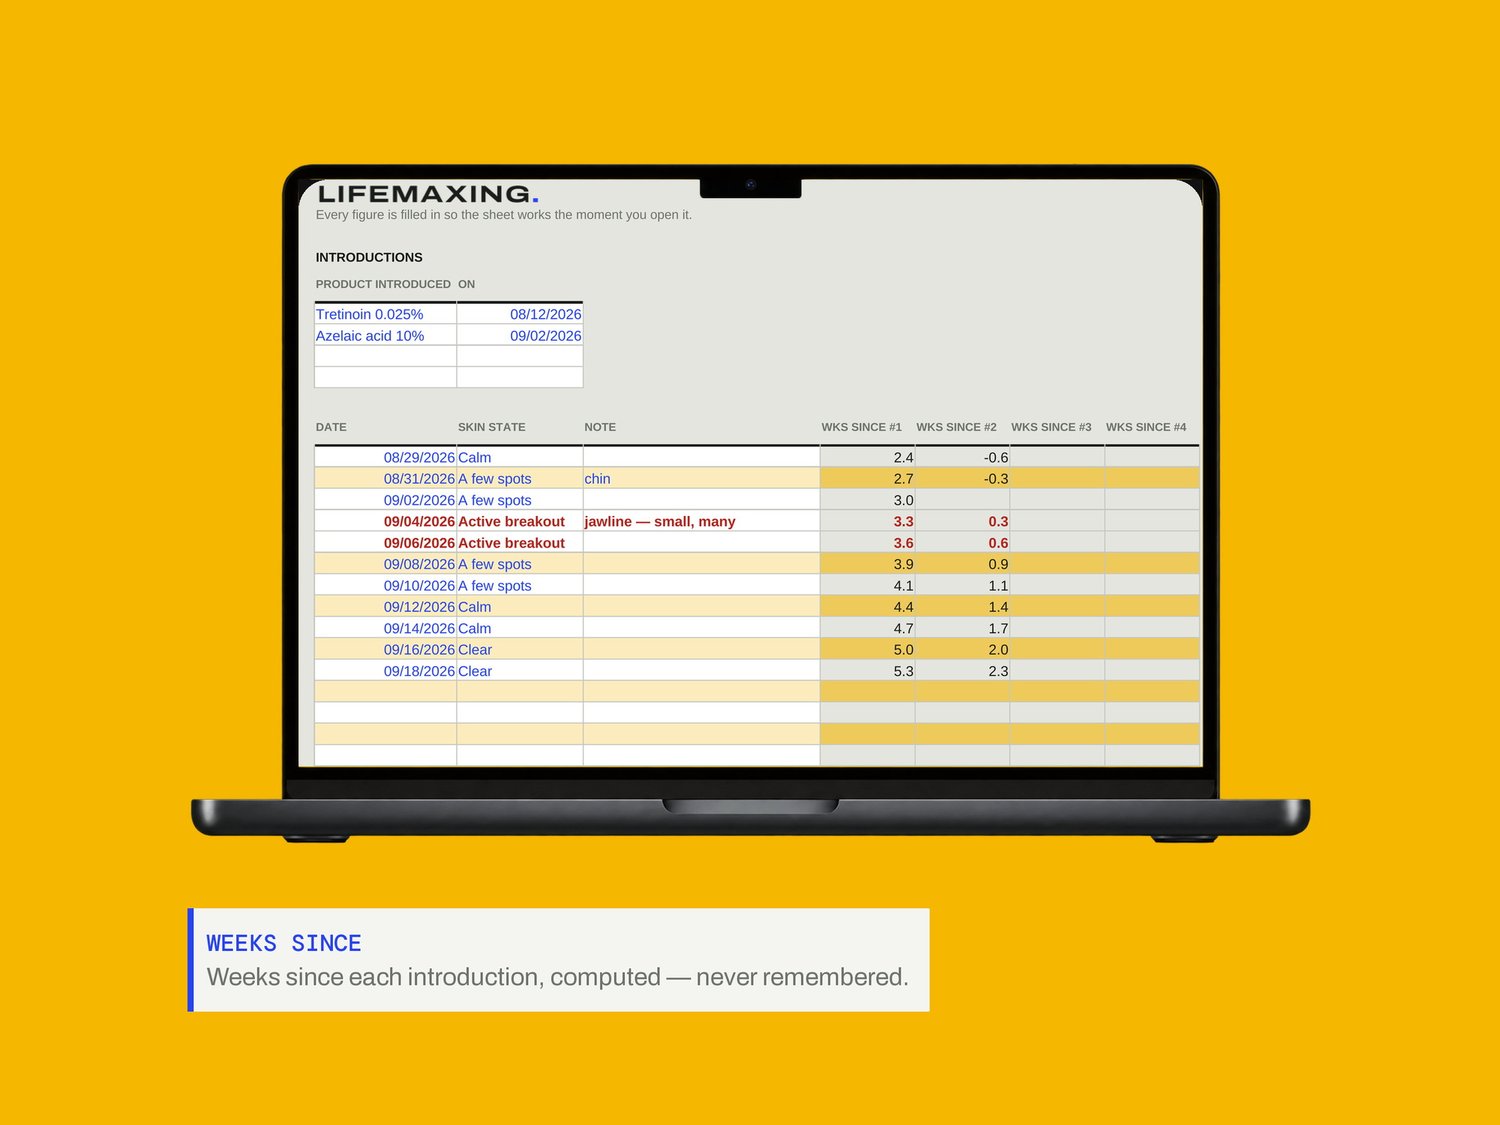
When you introduce a product you add it with its date, up to four at once, though fewer is better and one at a time is best. Then each day is one row: the date, a state from the dropdown, and a note if something is worth noting. Ten seconds. Miss days freely, because the timeline is made of dates rather than streaks and a gap changes nothing.
WHAT'S INSIDE
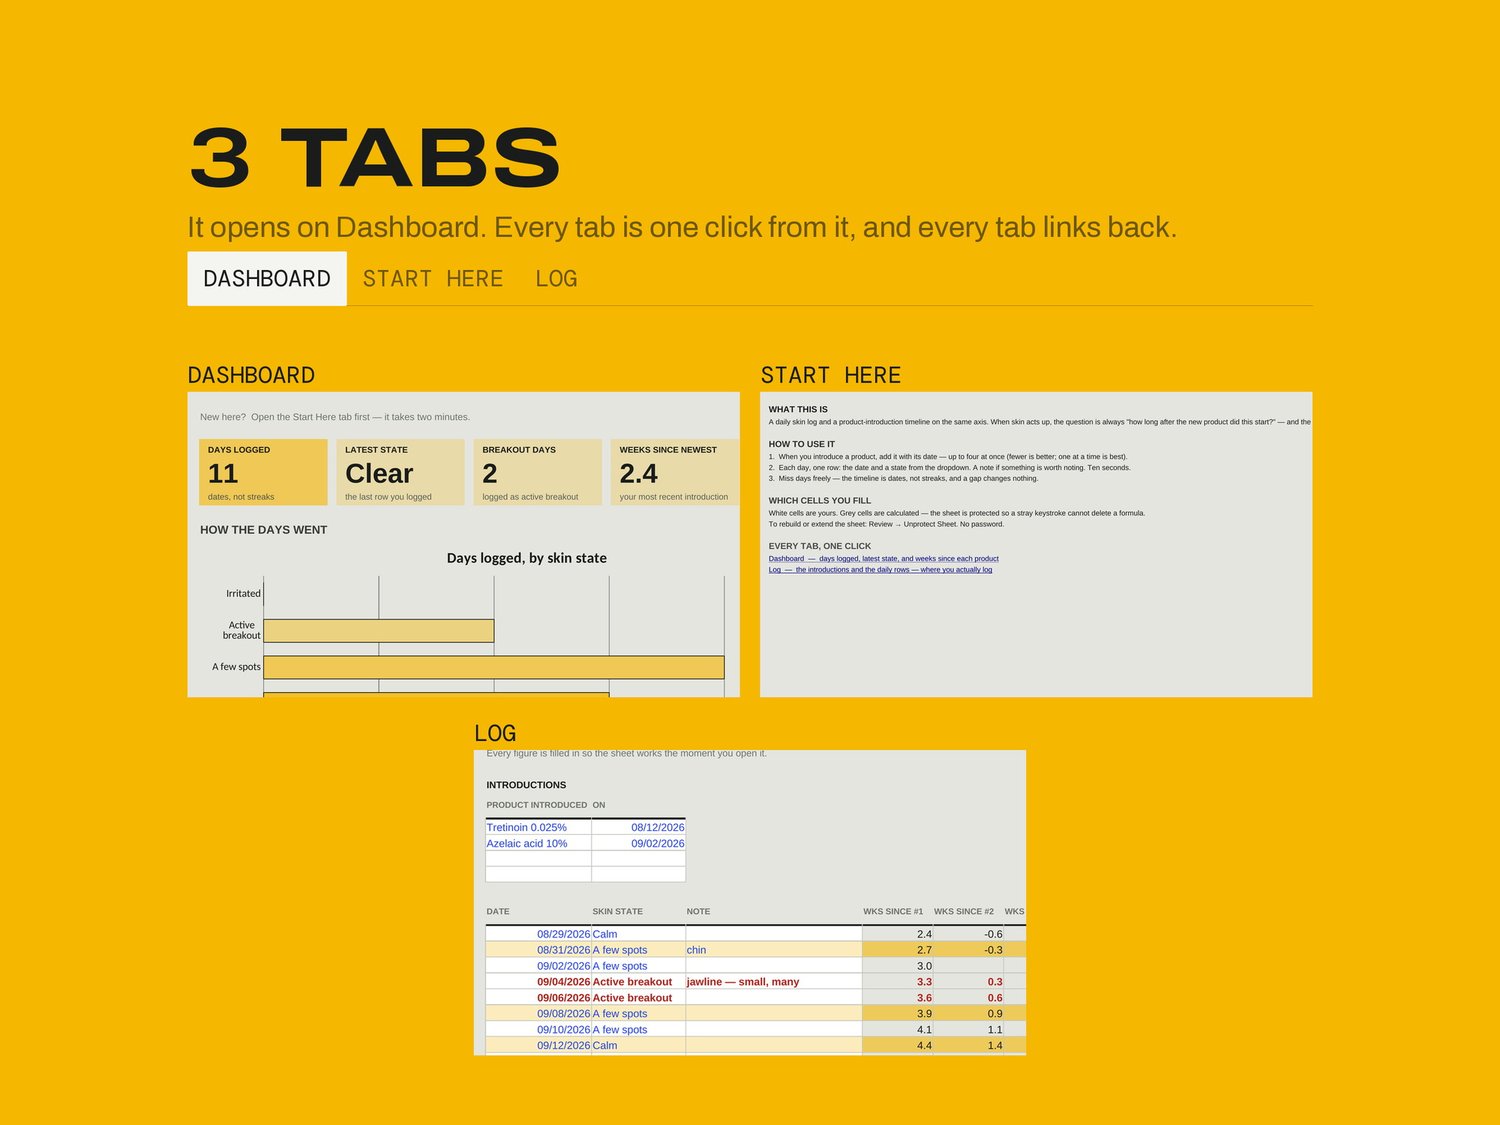
Dashboard - days logged, latest state, and weeks since each product
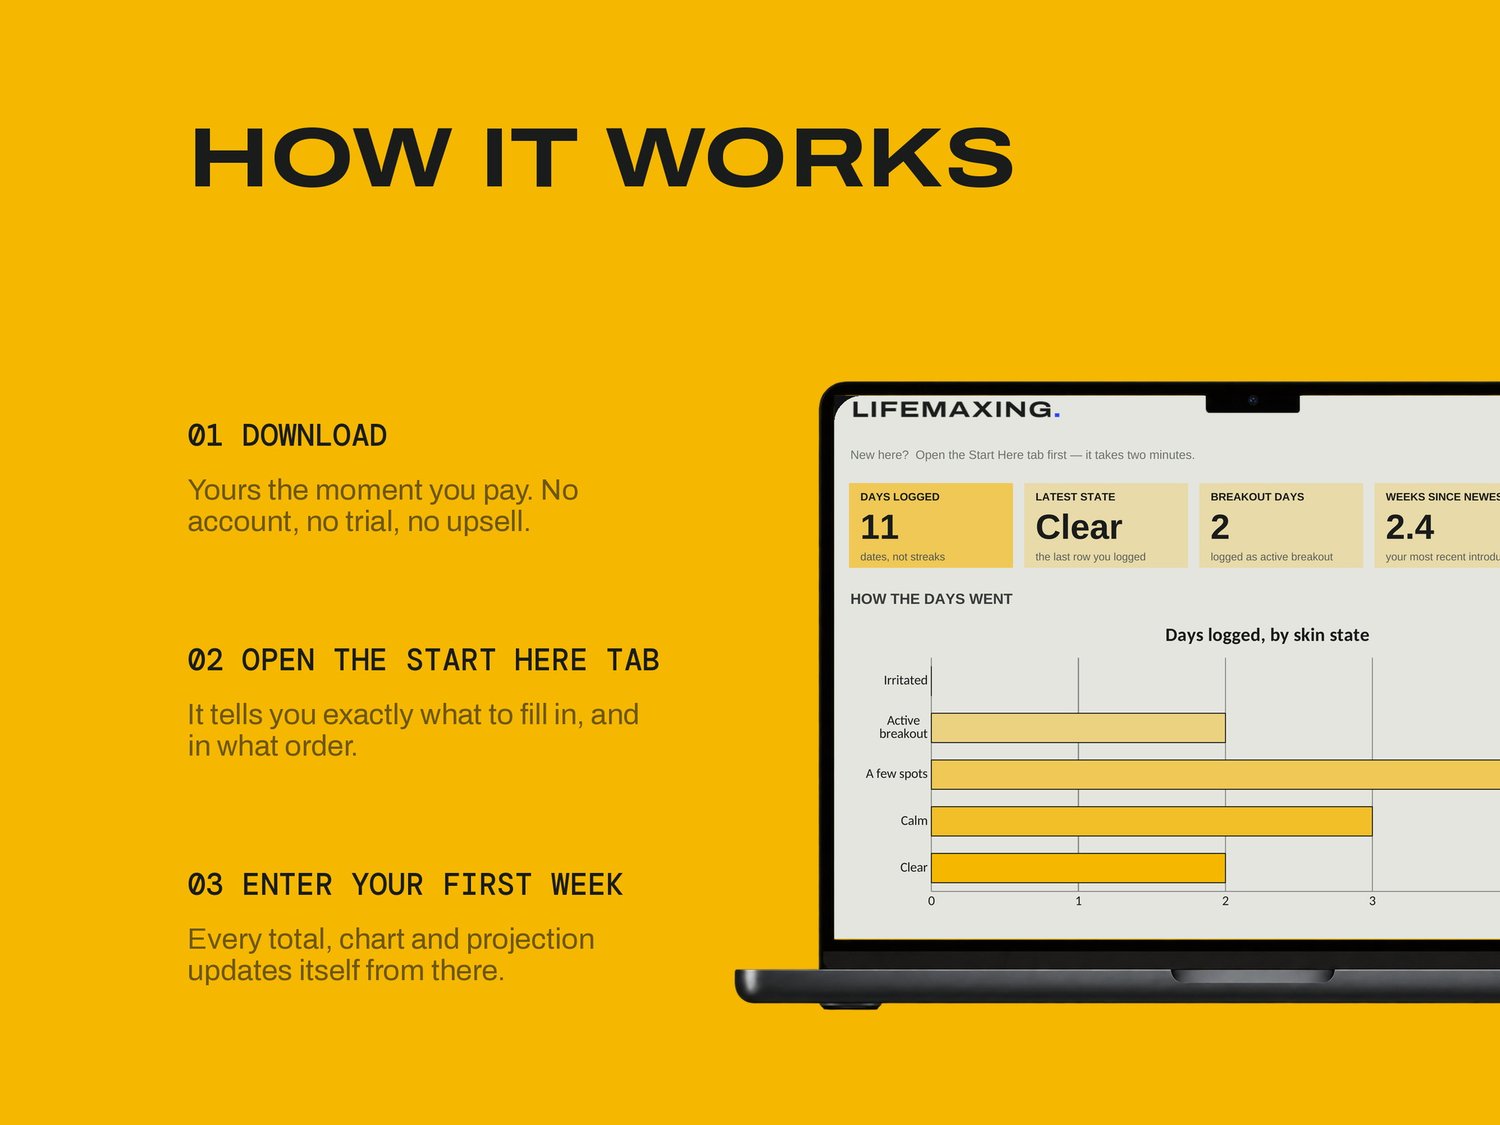
Start Here - how the file works and which cells are yours
Log - the introductions and the daily rows, where you actually log
THE PART NOBODY ELSE BUILDS
When skin acts up, the question is always how long after the new product this started, and the honest answer is almost never available, because nobody remembers the date they opened a bottle. Here the weeks-since column is computed from the introduction date you typed, sitting in the same row as the state you logged that day. You are reading a timeline rather than reconstructing one, which is the difference between a pattern and a story you told yourself.
WHAT YOU GET
Excel workbook (.xlsx)
Google Sheets template - one click to copy
Setup instructions (PDF)
Free updates for life
BEFORE YOU BUY
Works in Microsoft Excel 2016 and later, and in Google Sheets. It records dates and states and computes the interval between them. It does not tell you whether something is a purge or a breakout, and it gives no skincare or medical advice. Digital download, all sales final.