

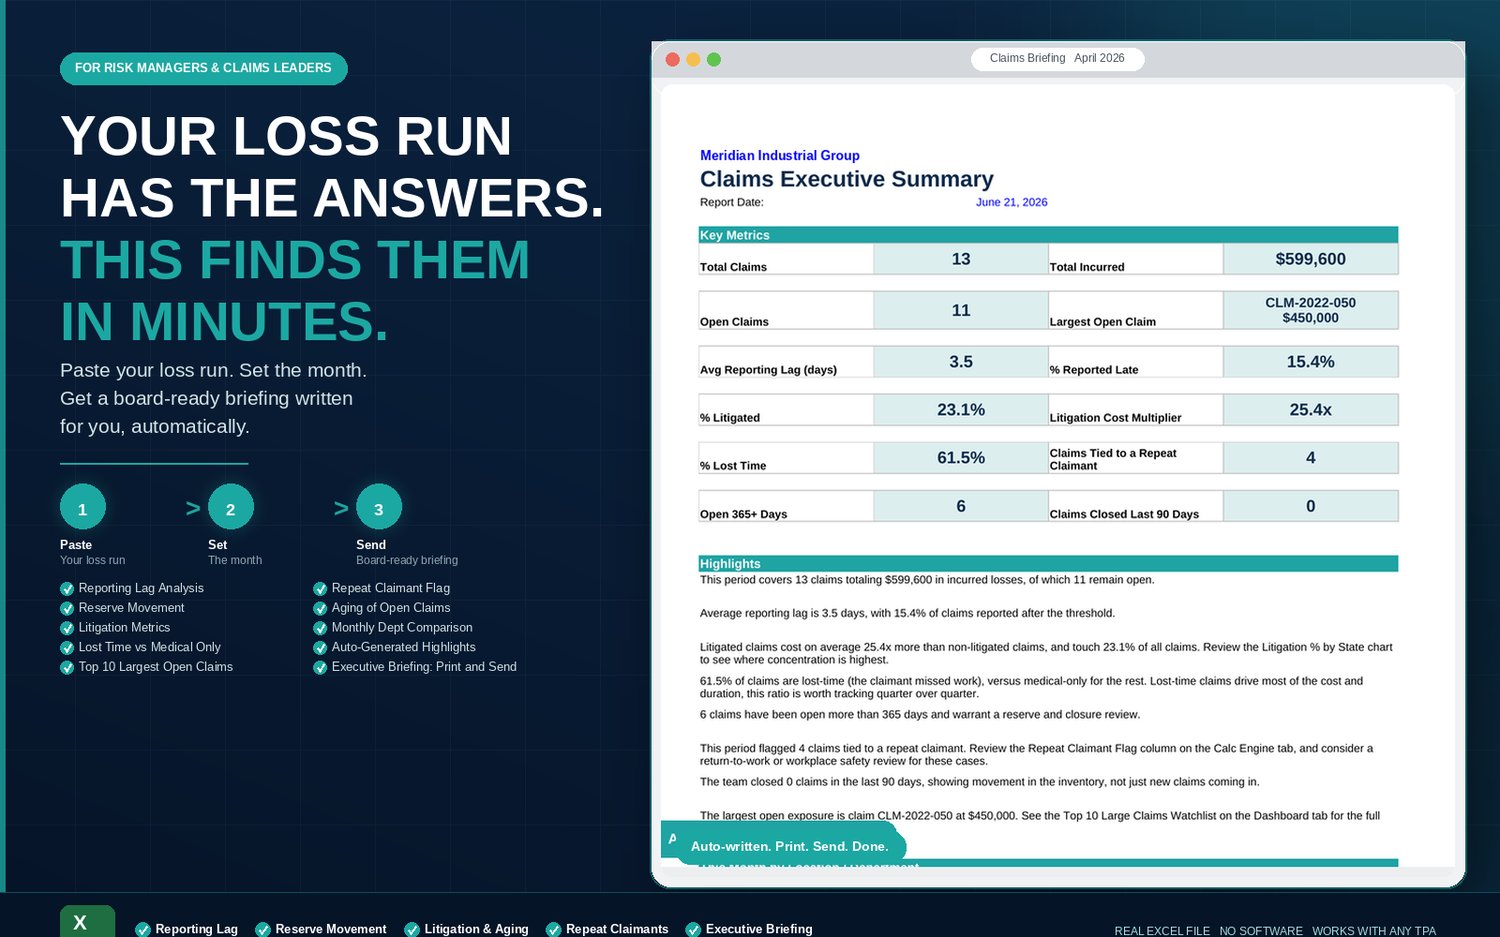
Monthly Claims Briefing Package
An Excel dashboard that turns your TPA loss run into a board-ready executive briefing in under 20 minutes. One-time purchase. Instant download. Works with any TPA.
You paste the data. The dashboard calculates reporting lag, reserve movement, litigation cost, lost-time ratio, claim aging, and your top 10 largest open exposures. Then it writes your executive highlights for you. Print the summary. Send it to your CLO, CFO, or VP Operations.
No RMIS. No software. No IT department. No monthly fee.
What happens when you use it
You get your TPA export. You paste it into the Raw Data tab. You set the month. The dashboard updates every chart, every KPI tile, every highlight sentence, and the ranked watchlist of your largest open claims. You type one paragraph of context in the comment box. You go to the Executive Summary tab, type your company name, and print.
That is the whole process. It takes under 20 minutes once your data is ready.
What it tracks automatically
- Reporting Lag: flags every claim reported after your threshold and trends it by year
- Reserve Movement: tracks period-over-period changes and flags significant increases or decreases
- Litigation Rate and Cost Multiplier: shows what percentage of claims have an attorney and how much more those claims cost compared to non-litigated ones
- Lost Time vs Medical Only: the ratio that tells you whether injuries are being managed before they become disability claims
- Open Claims by Age: shows how many claims are sitting at 0 to 90, 91 to 180, 181 to 365, and 365-plus days
- Top 10 Largest Open Claims: ranked by total incurred, always current, no manual sorting required
- Repeat Claimant Flag: identifies the same person appearing across multiple claims using name matching
- Monthly Department Comparison: compares lost-time claims by location versus the prior month and writes the observation for you
- Claims Closed Last 90 Days: shows inventory movement, not just new claims coming in
- Largest Open Exposure: the single biggest open claim by dollar, on the dashboard where leadership will ask about it
The executive summary writes itself
Eight highlight sentences generate automatically every time you paste new data. They cover total incurred, reporting lag, litigation multiplier, lost-time ratio, aging risk, repeat claimants, inventory movement, and your largest open exposure. You add one paragraph of your own context. Print. Send.
Your CLO, CFO, and VP Operations get a one-page briefing that looks like it took hours. It took 20 minutes.
Three steps every month
- Paste your loss run into the Raw Data tab
- Set the reporting month and add your context comment
- Print the Executive Summary and send to leadership
What you get
One Excel workbook. Five tabs.
Start Here — step-by-step setup guide, a copy-paste TPA data request email, and a field mapping cheat sheet for ESIS, Sedgwick, Gallagher Bassett, Broadspire, and Helmsman. Includes instructions for reserve calculation when your TPA splits reserves into separate columns.
Raw Data — paste your loss run here. Line of business codes from ESIS, Sedgwick, and other major TPAs map to WC, GL, and Auto automatically.
Calc Engine — every formula runs here. Nothing for you to edit. All 12,000-plus formulas are visible if you want to verify the logic.
Dashboard — 12 KPI tiles, 7 trend charts, a Top 10 Large Claims Watchlist, and a Monthly Department Comparison with auto-written observations. One yellow cell to set the month. One yellow box for your comment. Nothing else needs to be touched.
Executive Summary — one print-ready page. Type your company name. Add your comment. Print or save as PDF. Send.
Works with any TPA that exports to Excel or CSV
Field mappings are included for ESIS GRA, Sedgwick, Gallagher Bassett, Broadspire, and Helmsman. A Reference Guide tab inside the workbook covers TPA column names, reserve calculation instructions, lost time flag translation, and a seven-question troubleshooting guide.
Who this is for
Self-insured employers, large-deductible programs, and risk or HR leaders who manage their own claims program without a full analytics team. If your TPA sends you a raw export and you are rebuilding the same report every month by hand, this replaces that process permanently.
One-time purchase. Instant download. Use it this month.