
Oscilloscope Wave Lab
Oscilloscope Wave Lab: Phase Delay and Group Delay Demonstrator
A print-friendly guide to generated sine packets, imported WAV/MP3 audio, the SYSTEM transfer-function block, waveform and FFT displays, and phase-delay/group-delay interpretation.
Print-friendly HTML edition. Updated May 16, 2026.
Contents
Overview Quick Start SYSTEM Block Audio Filters Educational Presets Signals WAV/MP3 Audio Plots FFT Phase and Group Delay Monitoring Examples Limitations Troubleshooting
Overview
This app is an educational oscilloscope and spectrum lab. It can generate sine and cosine waves, evaluate custom formulas, import WAV/MP3 audio, and compare an input signal x(t) with an output signal y(t) after a configurable SYSTEM modifies phase, delay, and optional audio filtering.
Main idea
Phase delay and group delay become meaningful when you compare an input with an output after a system changes the signal phase.
input x(t) -> SYSTEM -> output y(t)
Best classroom demonstration
Use the Two-tone beat preset, then switch from Bypass to Pure Delay or Nonlinear Phase. Watch the carrier and envelope move together or apart.
Quick Start
- Open oscilloscope.html in a modern browser.
- Click Two-tone beat in Educational Presets.
- Set System Mode to Pure Delay and move Delay. The phase response becomes a straight line and phase delay equals group delay.
- Set System Mode to Nonlinear Phase and move Curvature alpha. Phase delay and group delay become different curves.
- Use Show input, Show output, and Show overlay to control the input/output waveform comparison.
- Click Monitor to hear generated output, or import an audio file and use Play plus Monitor audio.
System / Transfer Function
The SYSTEM block creates the output signal. For generated sine/cosine components, the app applies the phase law directly to each known frequency component.
x_k(t) = A_k sin(2 PI f_k t + theta_k)
y_k(t) = A_k sin(2 PI f_k t + theta_k + phi(f_k))
ModeMeaningExpected plot behaviorBypassy(t) = x(t). No phase modification.Input and output overlap. Phase delay and group delay are zero.Pure DelayDelays the signal by delayMs.Phase response is a straight sloped line. Phase delay and group delay are equal.Linear PhaseUses the same phase law as pure delay and emphasizes the straight-line phase response.Carrier and envelope move together.Nonlinear PhaseAdds curvature around a center frequency.Phase delay and group delay differ. The carrier can move differently inside the envelope.Custom Phase FunctionUses a user-entered expression for phi(f) in radians.Group delay is computed by numeric central difference.
Important formulas
phi(f) = -2 * PI * f * delaySeconds
phi(f) = -2 * PI * f * delaySeconds + alpha * (f - centerFrequencyHz)^2
phaseDelay(f) = -phi(f) / (2 * PI * f)
groupDelay(f) = -(1 / (2 * PI)) * dphi / df
Units: phase is radians, delay is seconds internally, and frequency is Hz. The app avoids angular-frequency notation in the UI except for each signal's optional Angular omega field.
Audio Filters in the SYSTEM Block
The SYSTEM block also includes practical audio filters. These are useful for hearing and seeing how a system changes an imported song or generated output.
FilterUseNoneNo extra filter.Low-passPreserves lower frequencies and reduces higher frequencies.High-passPreserves higher frequencies and reduces lower frequencies.Band-passPreserves a band around the filter frequency.NotchReduces a band around the filter frequency.All-pass phase shifterChanges phase while keeping magnitude comparatively steady. This is useful for demonstrating phase effects.
Filter Frequency sets the main frequency of the filter. Filter Q controls how narrow or resonant the filter is. High Q values can make strong peaks and may sound sharp.
Educational Presets
PresetFormulaTeaching purposeTwo-tone beatsin(2 PI 100 t) + sin(2 PI 102 t)Shows a carrier near 101 Hz and a 1 Hz beat envelope.Five-tone packet96, 98, 100, 102, and 104 Hz sinesShows a narrow packet around 100 Hz.Wider packet90, 95, 100, 105, and 110 Hz sinesShows stronger dispersion when nonlinear phase is applied.
Two-tone readout: the educational panel estimates phase delay at the center frequency and group delay from the phase difference between 100 Hz and 102 Hz.
Generated Signals
The Signals panel lists generated waves. Each signal can be enabled, muted, duplicated, deleted, or edited.
ControlPurposeKindSelects Sine, Cosine, or Custom f(t).Frequency Log SliderAdjusts frequency with audio-friendly log spacing.Frequency HzAllows exact numeric frequency entry. The slider and omega field update together.Angular omegaShows or accepts angular frequency in radians per second.PhaseSets the signal's initial phase in degrees.DelayApplies a per-signal time shift before the SYSTEM block.Custom FormulaEvaluates a JavaScript-style math expression using variables such as t, A, frequency, omega, phi, offset, delay, and a.
Custom formula limitation: custom formulas remain usable, but the SYSTEM cannot always decompose arbitrary formulas into sine components. For exact phase-delay demonstrations, use sine/cosine components or the educational presets.
Imported WAV/MP3 Audio
Click Import Audio to load a WAV or MP3 file. The file is decoded by the browser and can be analyzed silently or played through the audio output.
- Click Import Audio and choose a WAV or MP3 file.
- Select Mono mix, Left, or Right in the Audio File panel.
- Set Analysis Target to the imported file.
- Click Play to advance through the file.
- Enable Monitor audio if you want to hear the processed song.
Song processing: imported audio is processed for playback and analyzer output by pure/linear delay and the selected audio filter. Nonlinear/custom phase curves remain reference transfer-function curves for full songs.
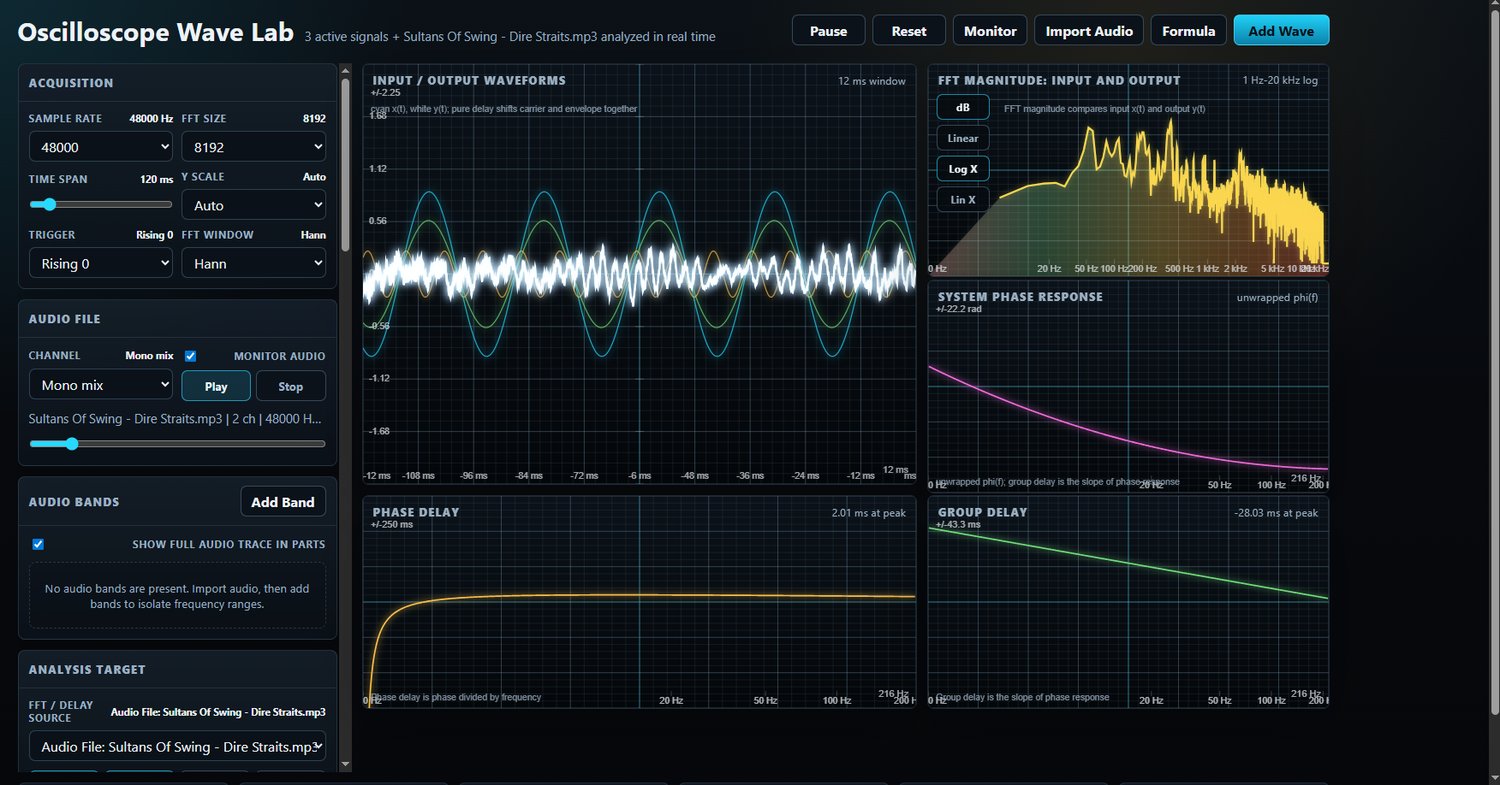
Plot Panels
PlotWhat it showsInput / Output WaveformsOverlays input x(t) and output y(t). Cyan is input and white is output.FFT Magnitude: Input and OutputCompares input and output spectra. Input uses cyan. Output uses yellow. The filled spectrum area uses a pleasant low-to-high frequency gradient.System Phase ResponsePlots phi(f) in radians. Use Wrapped phase plot to wrap the display, but delay calculations use unwrapped phase.Phase DelayPlots -phi(f) / (2 PI f).Group DelayPlots -(1 / 2 PI) dphi / df.
FFT Controls
The FFT plot has a vertical control column for magnitude and frequency scale.
ButtonEffectdBShows magnitude on a logarithmic decibel scale. Useful for audio and weak harmonics.LinearShows magnitude on a linear scale. Useful for simple sine demonstrations.Log XShows frequency on a logarithmic axis. Useful for broad audio ranges.Lin XShows frequency on a linear axis. Useful for closely spaced tones such as 100 Hz and 102 Hz.
Resolving close tones: if 100 Hz and 102 Hz merge into one peak, increase FFT Size. At 48 kHz, 8192 samples gives about 5.86 Hz resolution, while 32768 samples gives about 1.46 Hz resolution.
Phase Delay and Group Delay
Phase delay
Phase delay describes how much a sinusoidal carrier appears shifted at a single frequency.
phaseDelay(f) = -phi(f) / (2 PI f)
Group delay
Group delay describes how the envelope or packet moves. It is the negative slope of phase versus frequency.
groupDelay(f) = -(1 / 2 PI) dphi / df
Pure delay: phase delay and group delay are equal. Nonlinear phase: phase delay and group delay generally differ.
Audio Monitoring
ControlWhat you hearMonitor in the top toolbarPlays the generated SYSTEM output y(t).Monitor audio in the Audio File panelPlays the imported WAV/MP3 through the current SYSTEM delay/filter path.
Clicks: the app uses short ramps and smoothed parameter changes, but clicks can still occur when rebuilding the audio graph, switching filter type, using very high Q, or making abrupt delay changes.
Examples
Example 1: Pure delay on two-tone beat
- Click Two-tone beat.
- Set System Mode to Pure Delay.
- Set Delay to about 20 ms.
- Observe that the phase-response plot is a straight sloped line.
- Observe that phase delay and group delay are flat and equal.
Example 2: Nonlinear phase dispersion
- Click Two-tone beat or Wider packet.
- Set System Mode to Nonlinear Phase.
- Set Center Frequency to 101 Hz for the two-tone preset or about 100 Hz for packet presets.
- Try Curvature alpha values such as 0.005 or -0.005.
- Compare the phase-delay and group-delay curves.
Example 3: Imported song through a filter
- Import an MP3 or WAV file.
- Set Analysis Target to the imported file.
- Select Low-pass, High-pass, or All-pass phase shifter in Audio Filter.
- Click Play. Enable Monitor audio if you want to hear it.
- Watch the input/output waveform and FFT magnitude change as the song progresses.
Important Limitations
- The delay curves show the selected SYSTEM transfer function. They do not automatically become live measured curves from a song unless a separate measured cross-phase mode is added.
- Generated sine/cosine components are processed exactly by adding phi(f_k) to each component.
- Custom formulas remain supported, but arbitrary formulas are not fully decomposed into sine components for exact phase processing.
- Imported audio supports pure/linear delay and selected audio filters for playback/analyzer output.
- Arbitrary nonlinear/custom phase processing for full songs would require block FFT processing with inverse FFT and overlap-add. The app marks this as a future implementation path.
Troubleshooting
SymptomLikely cause and fixPhase and group delay are flat at zero.System Mode is probably Bypass. Choose Pure Delay or Nonlinear Phase.Two-tone FFT shows one broad peak.FFT resolution is too coarse. Increase FFT Size and use Lin X.Only one tone is active, but two traces appear.The waveform panel compares input x(t) and output y(t). Uncheck Show input or Show output to see one trace.Imported song delay curves do not move as the song plays.This is normal. The curves describe the SYSTEM, not the changing musical content. The waveform and FFT magnitude move with the song.Clicks during audio tests.Abrupt graph rebuilds, high Q, or fast parameter jumps can click. Change delay/filter controls slowly and avoid very high Q when monitoring.No sound from generated signals.Click Monitor in the top toolbar and check browser audio permissions/output volume.No sound from imported audio.Enable Monitor audio, then click Play in the Audio File panel.
Oscilloscope Wave Lab Phase Delay and Group Delay Demonstrator. This document is designed for browser printing to paper or PDF.