




Perpetual Futures Explained — Measured (PDF Guide)
Somebody explained perpetuals to you as futures without an expiry date, mentioned funding, and moved on. So you know the words but not the numbers: how often the contract is crowded on one side, what that costs, and whether any of it tells you anything about where price goes next.
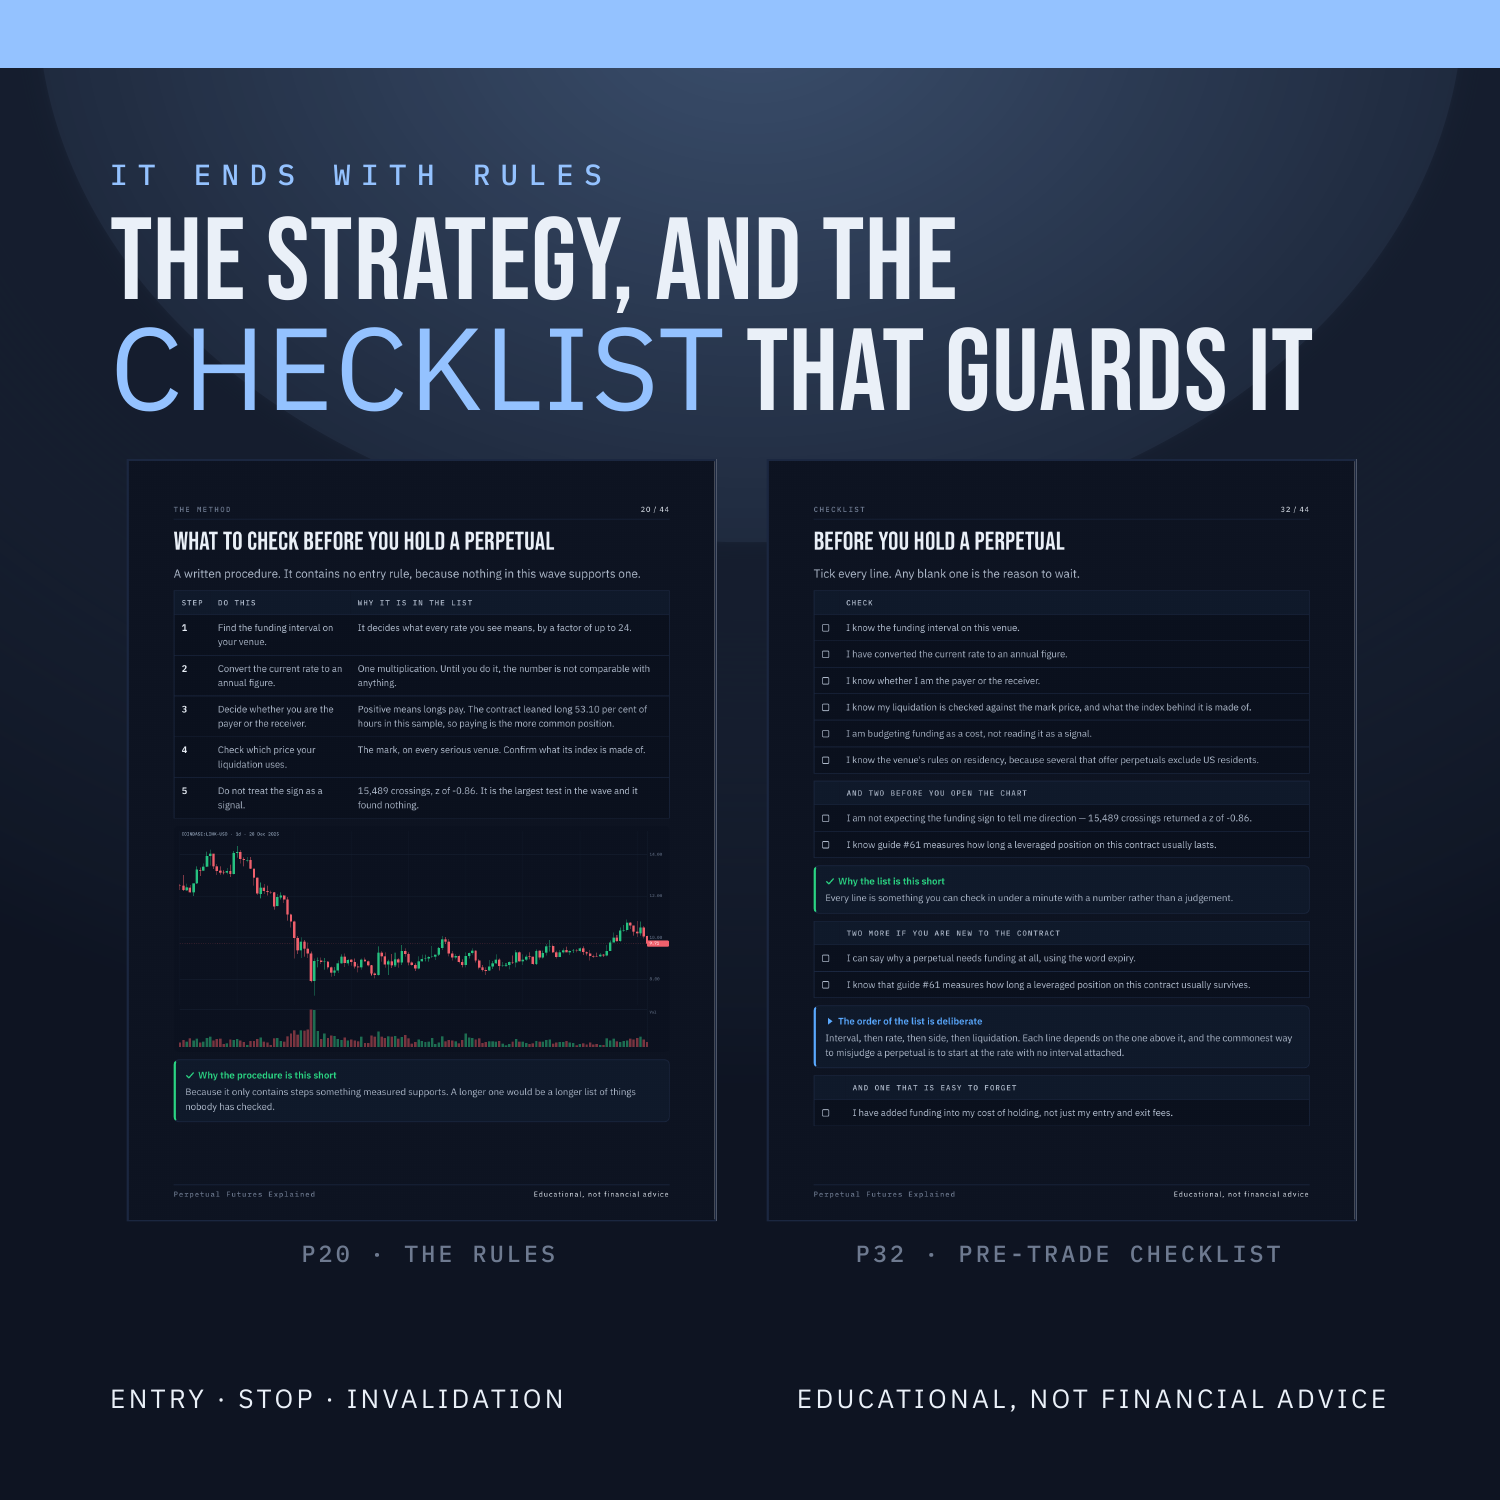
This guide takes 87,778 hourly funding readings from a real derivatives venue, joined to 88,000 bars of spot price on the same ten instruments, and measures the contract instead of describing it. How often it leans long, how much that costs to sit through, and what a change of sign is worth as a signal. This is a 44-page PDF that teaches Perpetual Futures from the first thing you see on the screen through to a written strategy with an entry, a stop and an explicit rule for when the trade is wrong.
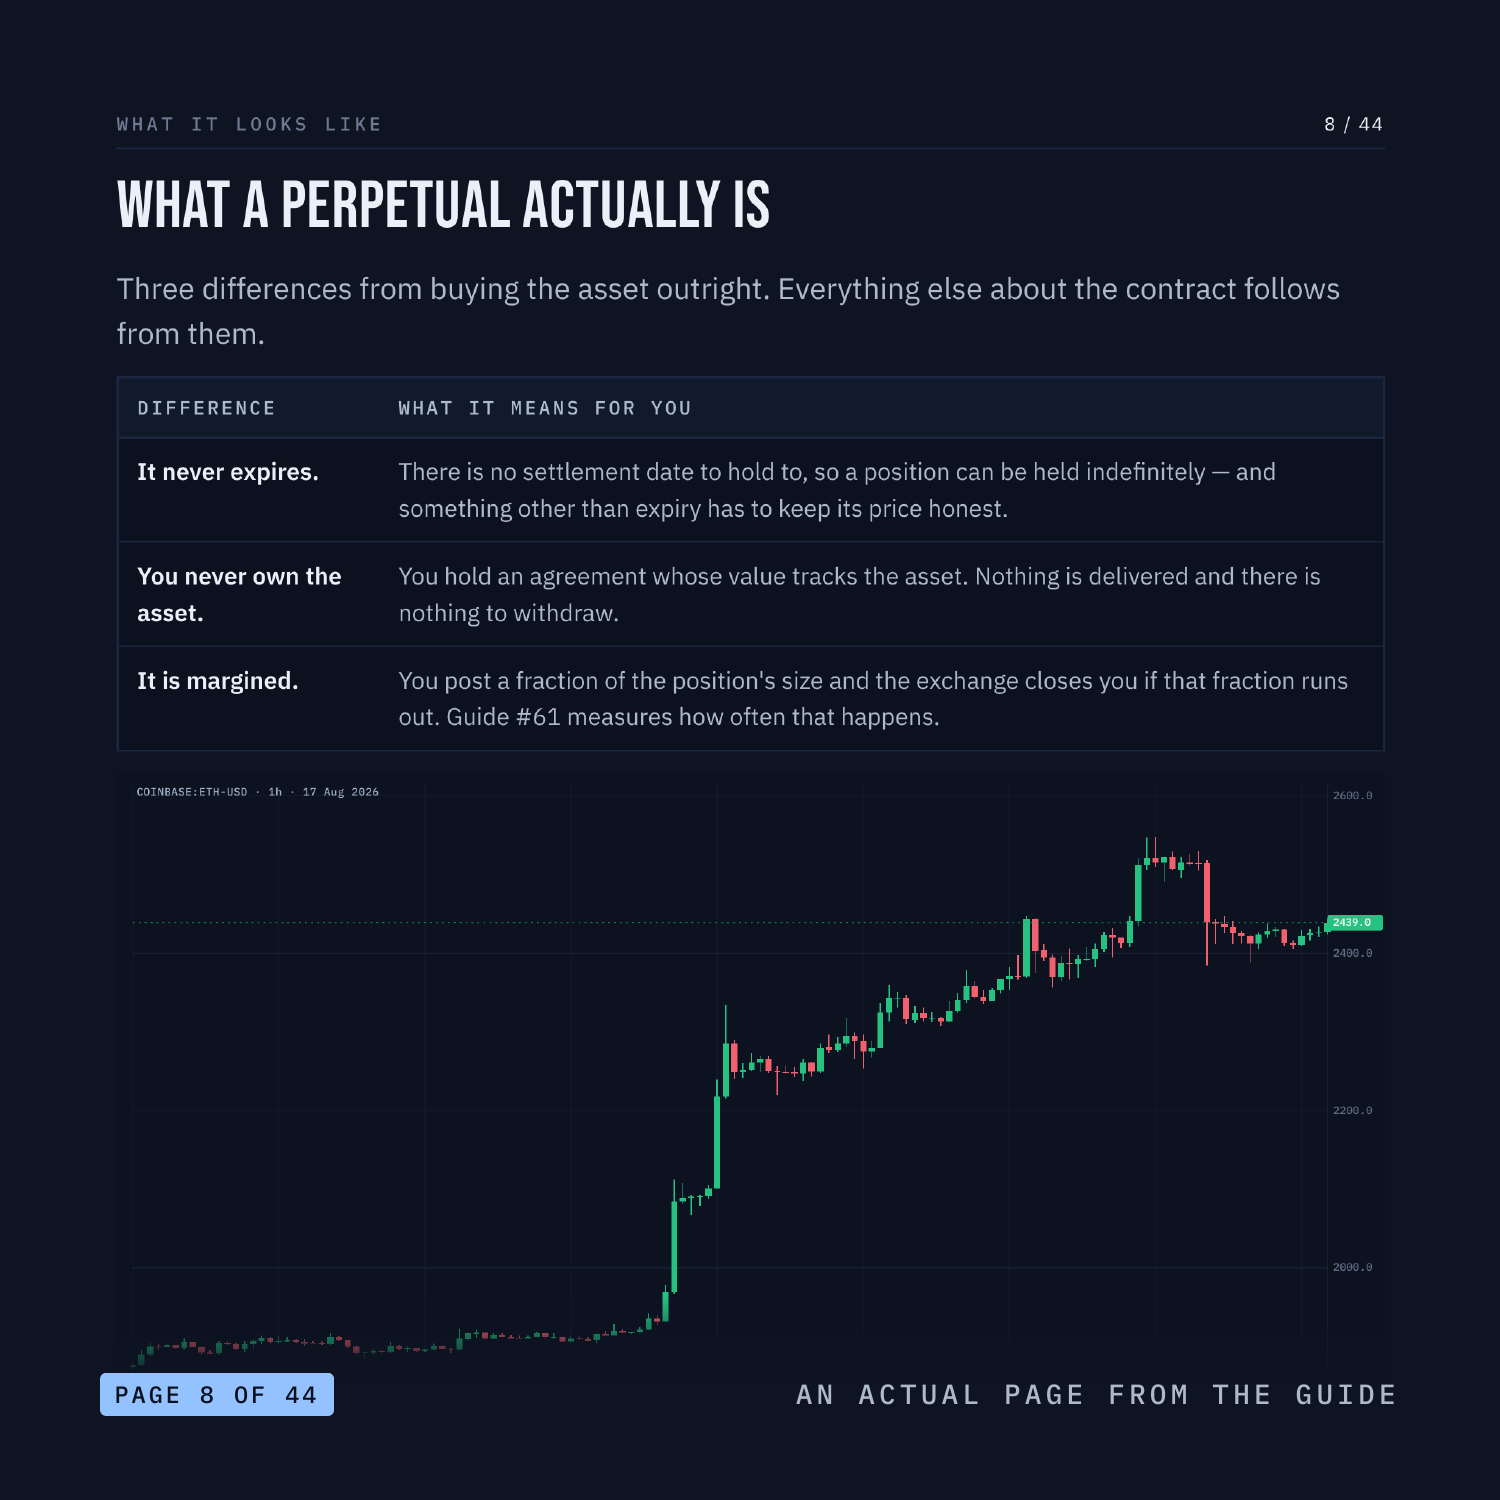
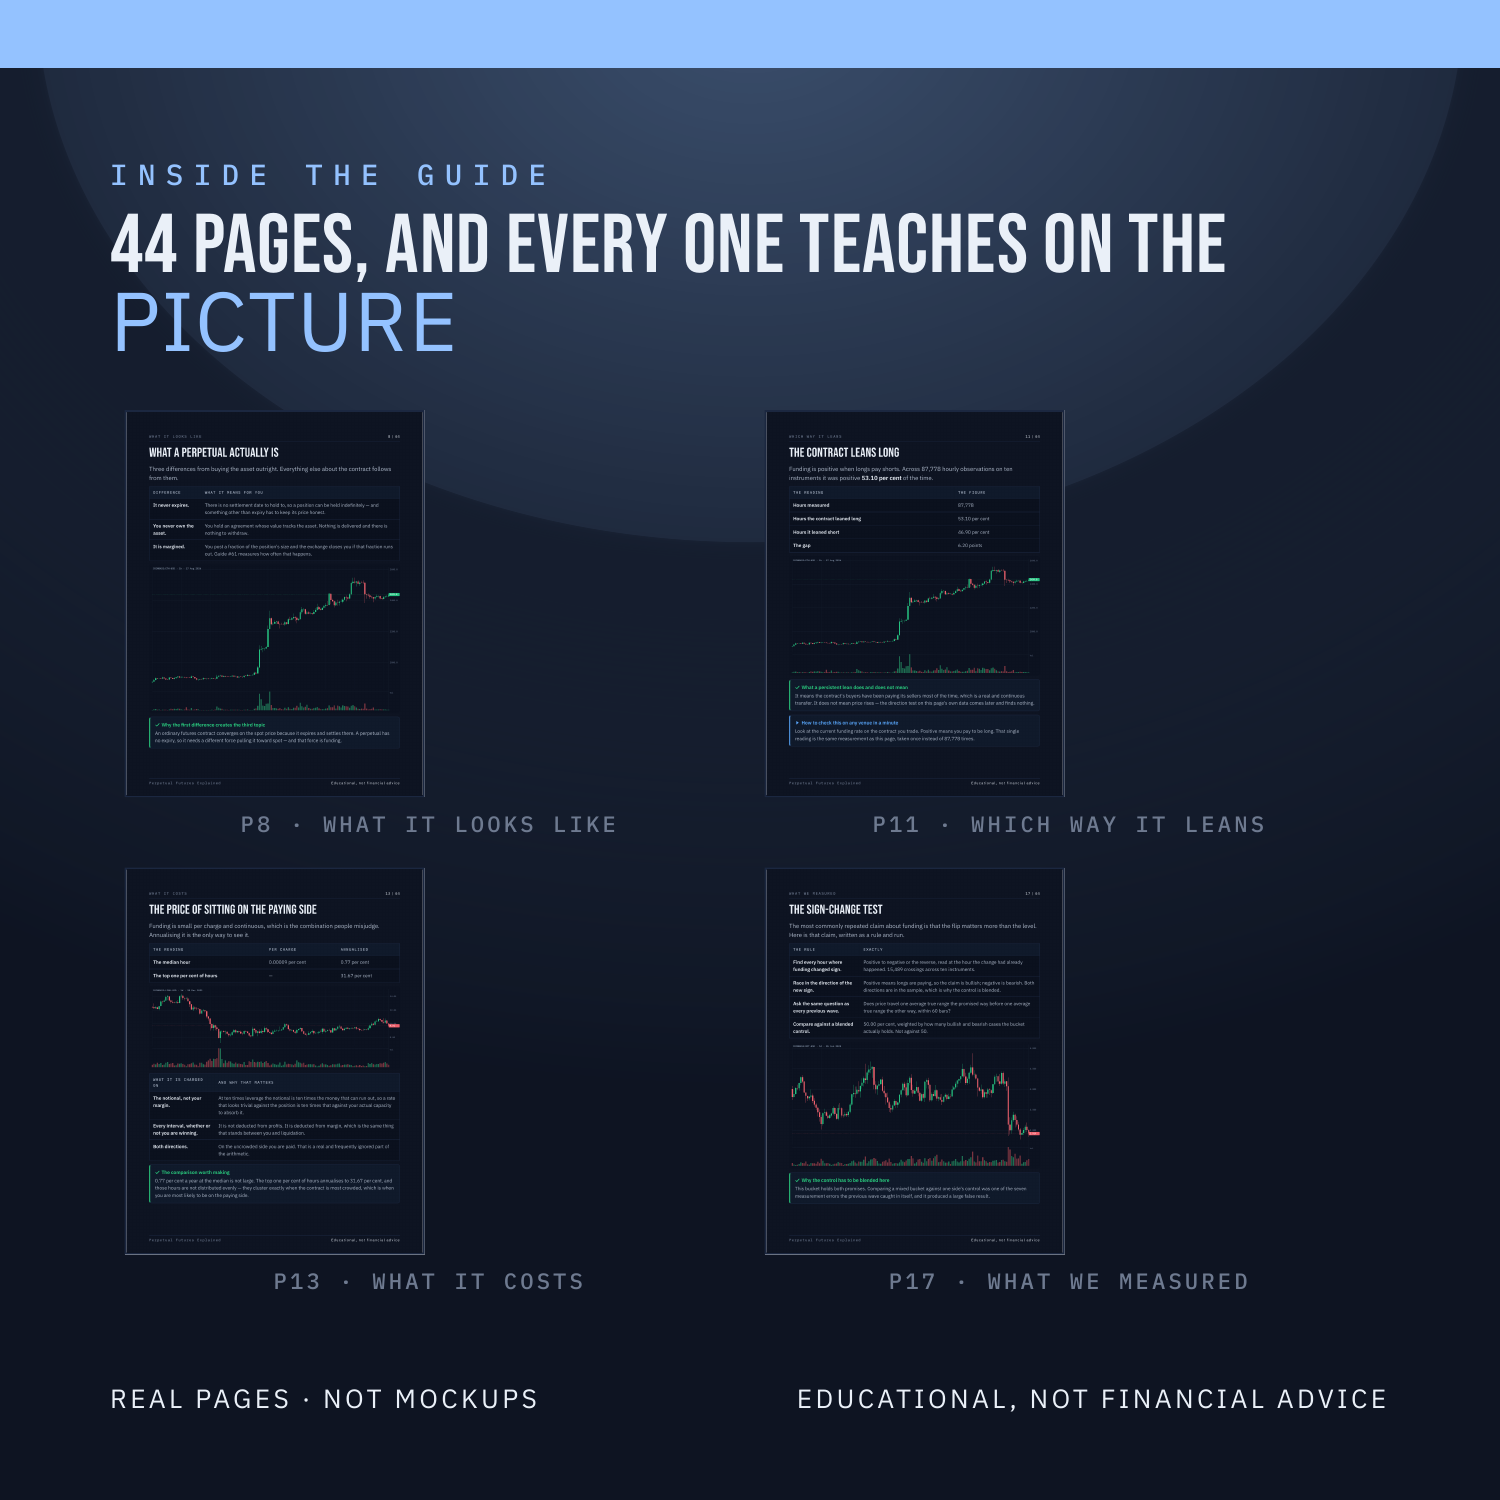
Nothing is taught underneath a chart. Every label sits on the candle, the line or the level it is describing, on real BTC, ETH, SOL and LINK charts. There are three quizzes on real charts, each followed by the same chart re-shown annotated with the reasoning, plus faded practice pages where the first steps are filled in and you finish the rest.
WHAT'S INSIDE
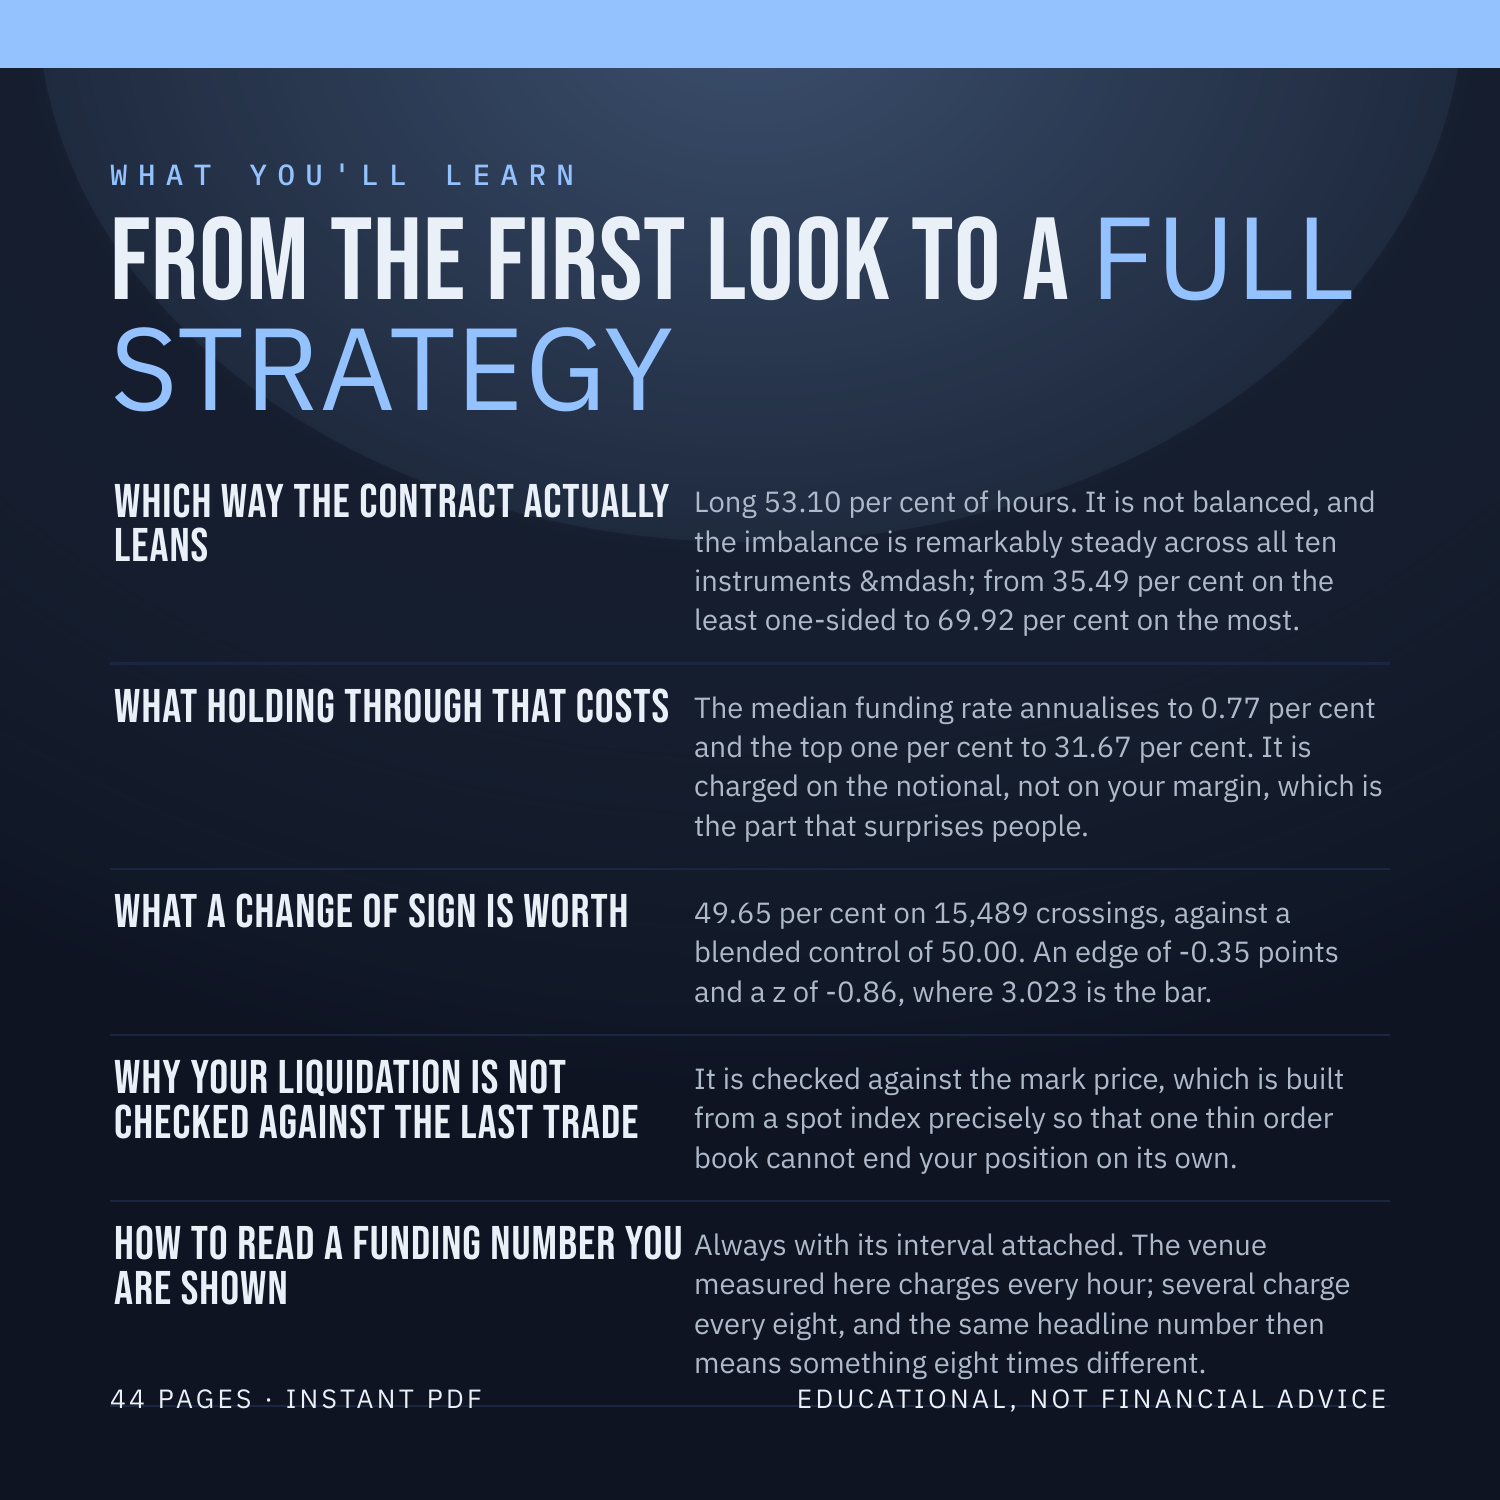
Which way the contract actually leans - Long 53.10 per cent of hours. It is not balanced, and the imbalance is remarkably steady across all ten instruments.
What holding through that costs - The median funding rate annualises to 0.77 per cent and the top one per cent to 31.67 per cent. It is charged on the notional, not on your margin, which is the part that surprises people.
What a change of sign is worth - 49.65 per cent on 15,489 crossings, against a blended control of 50.00. An edge of -0.35 points and a z of -0.86, where 3.023 is the bar.
Why your liquidation is not checked against the last trade - It is checked against the mark price, which is built from a spot index precisely so that one thin order book cannot end your position on its own.
How to read a funding number you are shown - Always with its interval attached. The venue measured here charges every hour; several charge every eight, and the same headline number then means something eight times different.
WHAT YOU'LL BE ABLE TO DO
Say what a perpetual is without using the word derivative.
Read a funding rate with its interval and convert it to a year.
Explain why funding exists rather than just that it does.
Tell the mark price from the last traded price, and say which one ends your position.
Judge any funding claim by its control and its sample size.
AN HONEST NOTE
Perpetual Futures is a clue, not a crystal ball. It describes what price has already done. This guide contains no win rates, no historical-test results and no promises about what you will make, because nobody can verify those and you should not trust anyone who prints them. What it hands you instead is a set of rules you can test yourself on TradingView in an afternoon. Educational, not financial advice.
Instant download. 44 pages, PDF.