

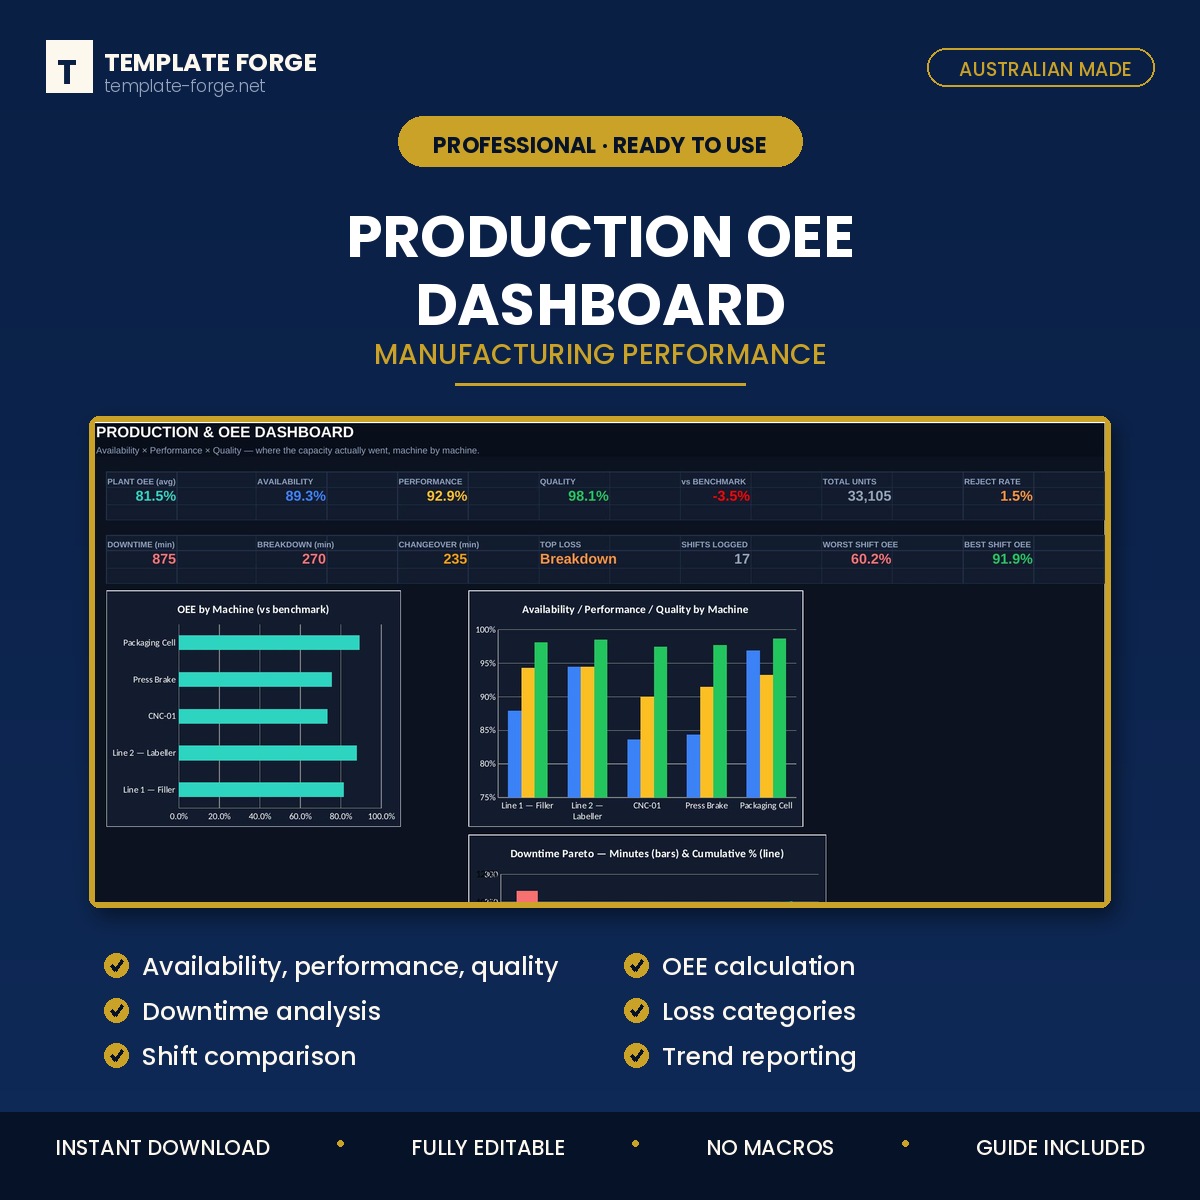





Production OEE Dashboard
Production OEE Dashboard
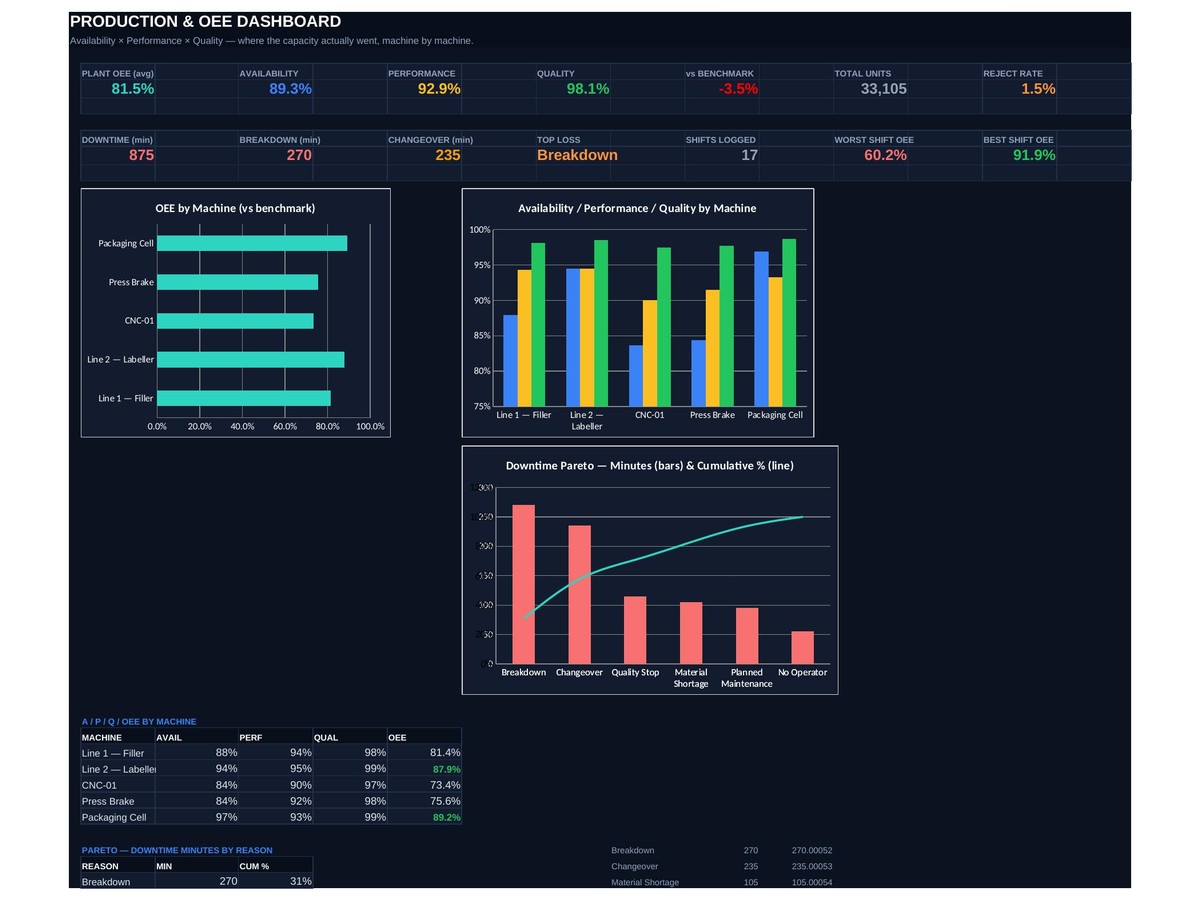
Overall Equipment Effectiveness calculated properly — availability, performance and quality, and the losses behind each one.
OEE is easy to quote and easy to get wrong. This workbook computes it the standard way, from your own production data, and then shows what is actually dragging it down: which downtime causes cost the most hours, which shifts run best, and where the quality losses sit.
What's inside
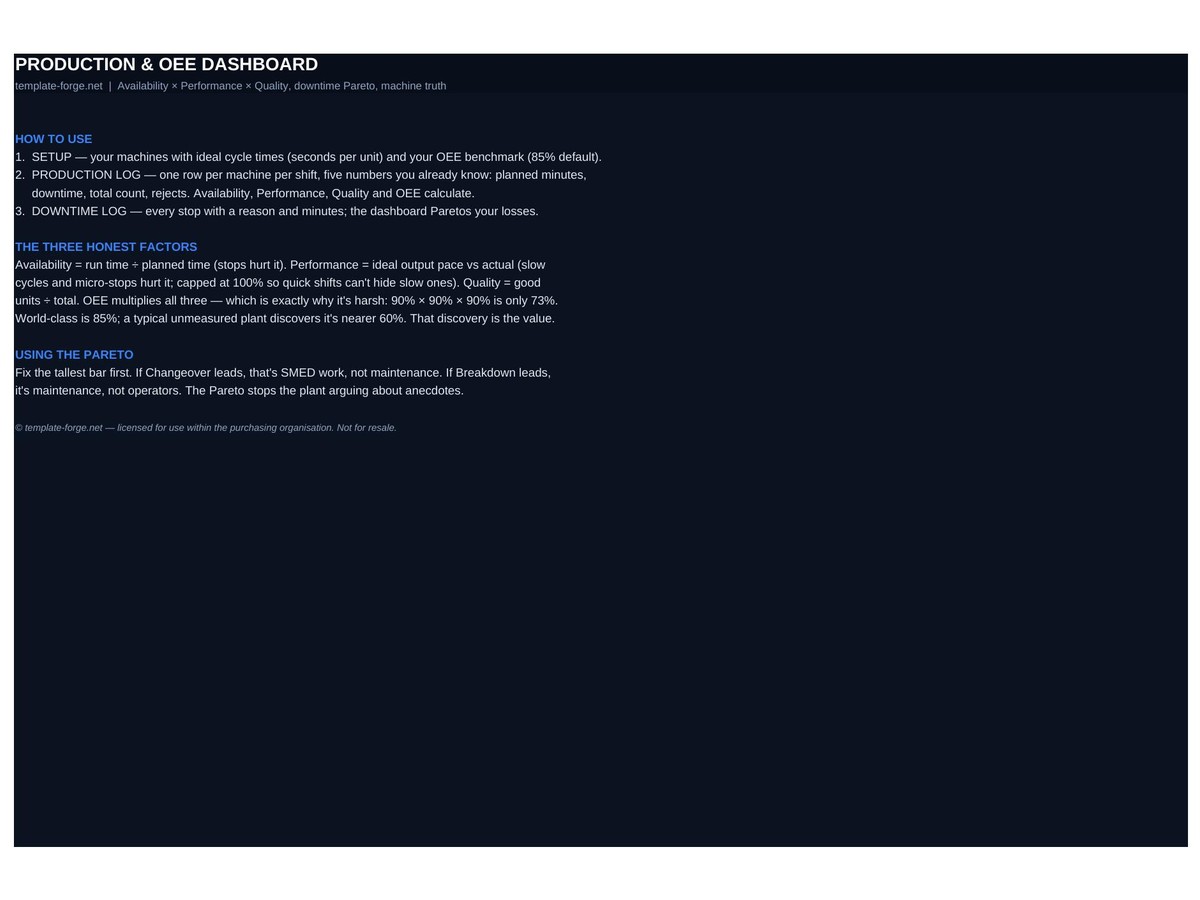
- OEE calculation — availability × performance × quality, computed from your run data
- Downtime analysis — a Pareto of loss causes, so the biggest problem is obvious
- Loss categories — planned, unplanned, changeover, speed and quality losses separated
- Shift comparison — how each shift and line performs against the others
- Trend reporting — OEE over time, so improvement is measurable rather than claimed
- Dashboard — the plant's performance on one screen
How it works
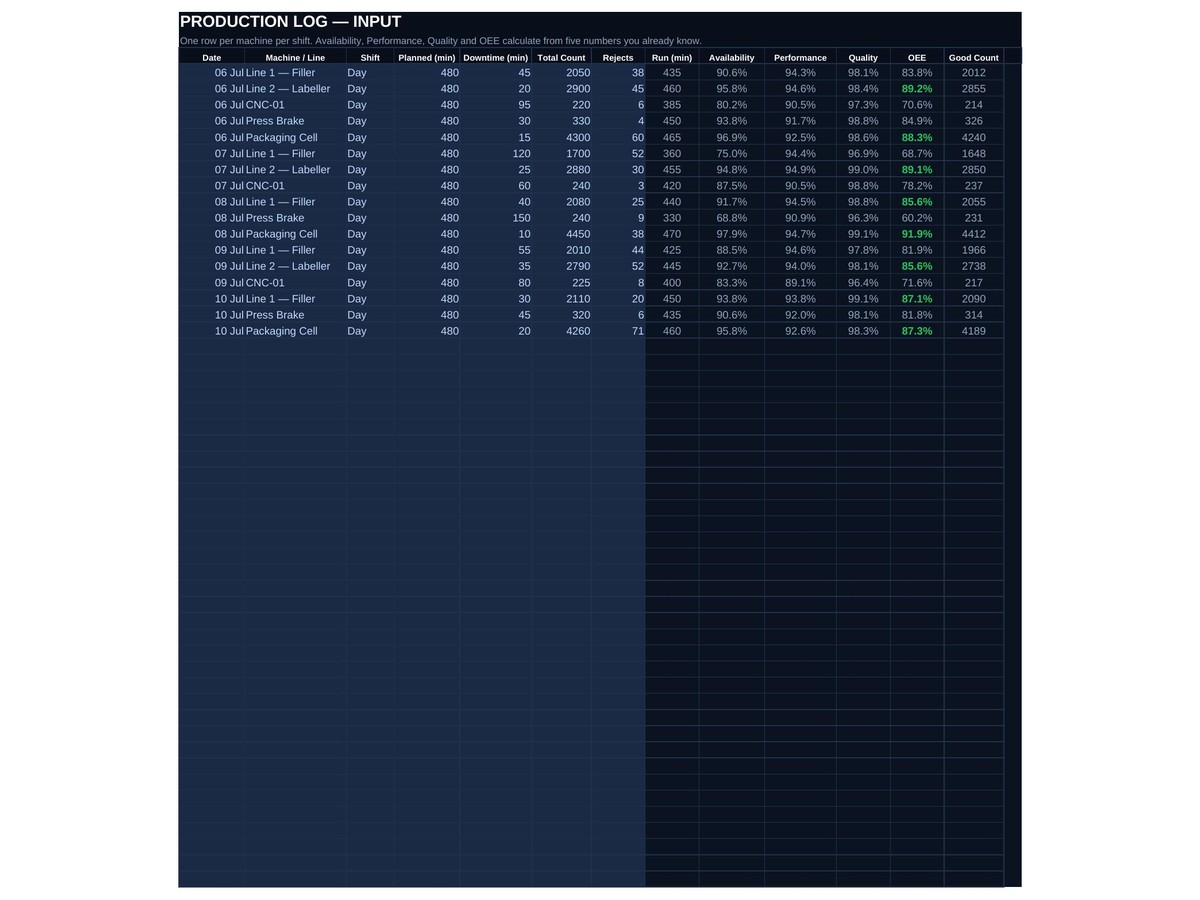
Log each production run — planned time, downtime, output and rejects — and every metric calculates. No macros, no add-ins, no subscription — a normal Excel file that opens on any version of Excel and keeps working forever.
Built in Australia from more than twenty years of program delivery experience. Instant download, yours to keep, use it across as many lines or plants as you like.