


Inspector Grapher, Core Status Grapher with EzSVG *Trial (activation license required)
Q-SYS plugin Component Inspector Grapher with EzSVG (Trail time is 2 minutes)
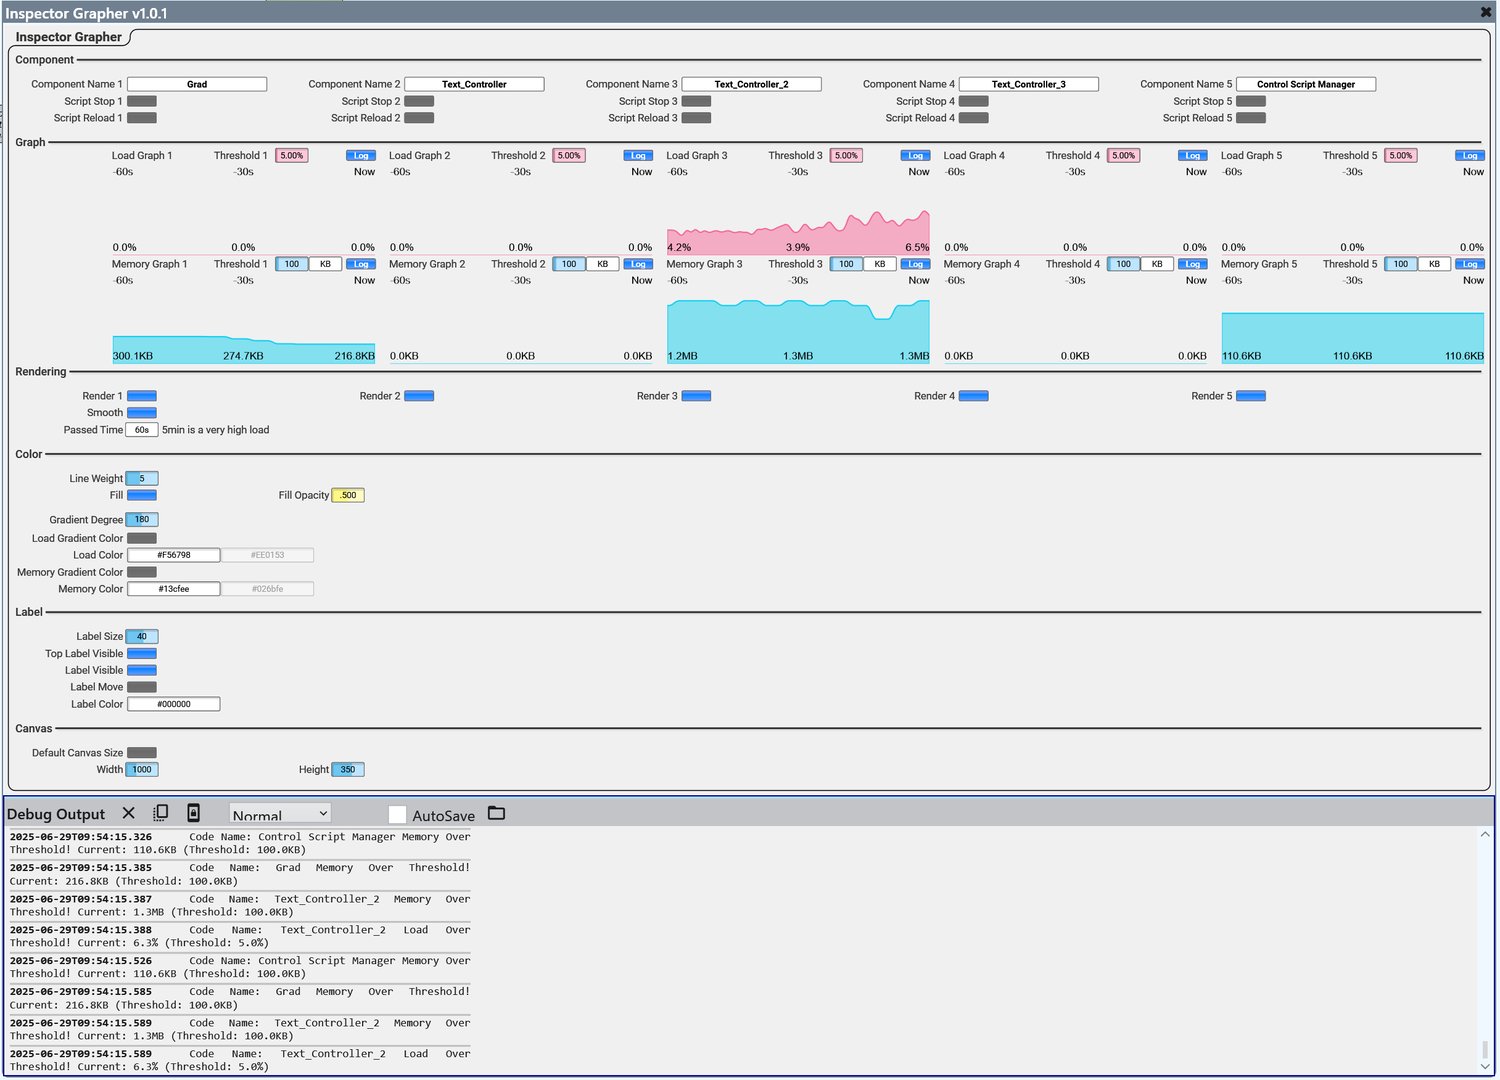
This plugin visualizes the load and memory of selected components using the EzSVG graph.
If the thresholds you set are exceeded, it records the event in the event log.
Q-SYS plugin Core Status Verbose Grapher with EzSVG (Trail time is 1 minute)
This plugin visualizes the Core status (verbose) percentages of memory, control, process, and RUA using EzSVG graphs.
When the set thresholds are exceeded, it records the event in the event log.
For both, please enable Script Access (such as All) in the properties.
For Core Status, also set Verbose to true.
*Core Status Grapher cannot be draw svg through emulation.
--v1.0.1----------------------------------20250629
added a feature that records events in the event log when the set thresholds are exceeded.
--------------------------------------------
--v1.0.0----------------------------------20250627
Initial release
--------------------------------------------
*Note and Caution-------------------------------------
As you know, use this plugin at your own risk.
*Test Equipment
QDS ver 10.0
On the iPad app, opacity becomes disabled when using gradients, so opacity is only enabled when using a solid color without gradients.