
IT Spend & Cost Analysis Dashboard Power BI
On Sale
$40.00
$40.00
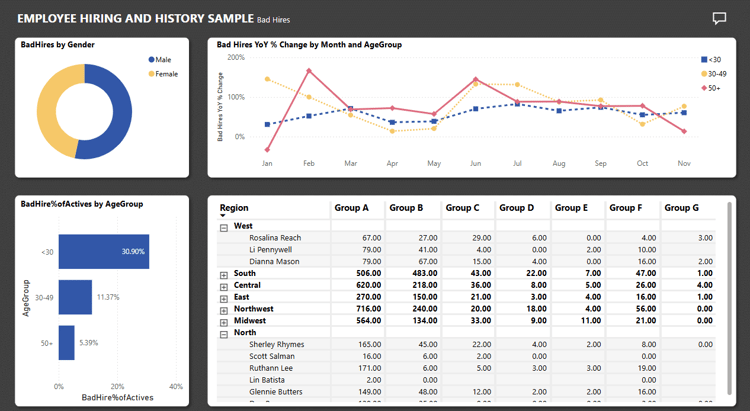
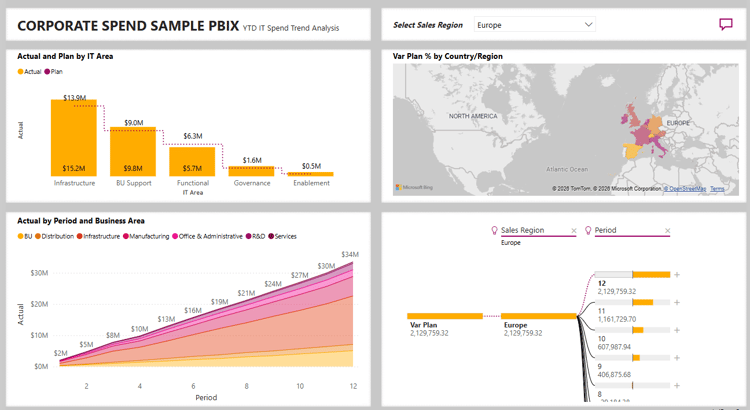
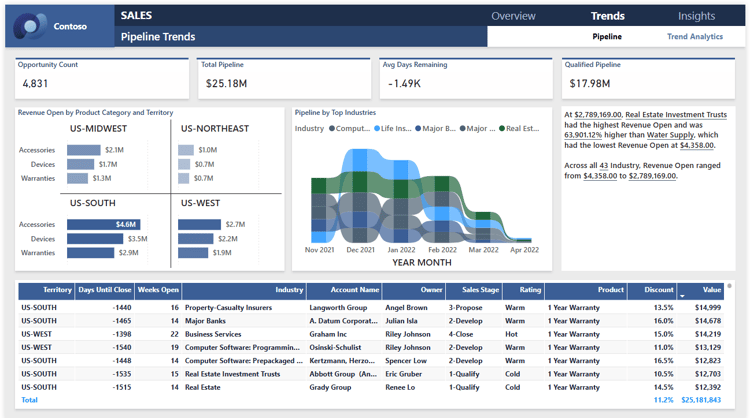
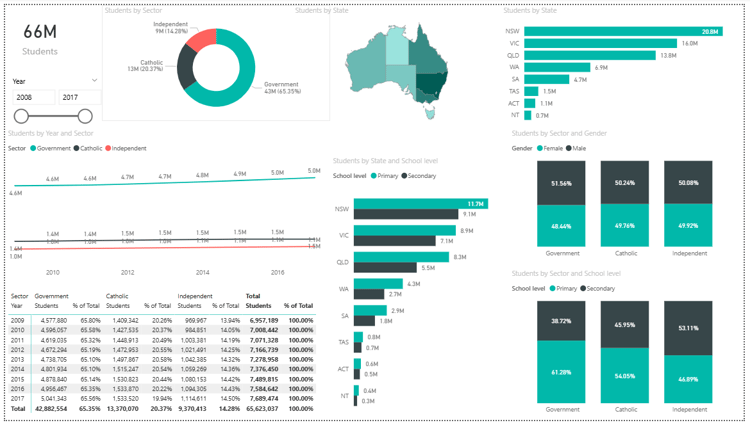
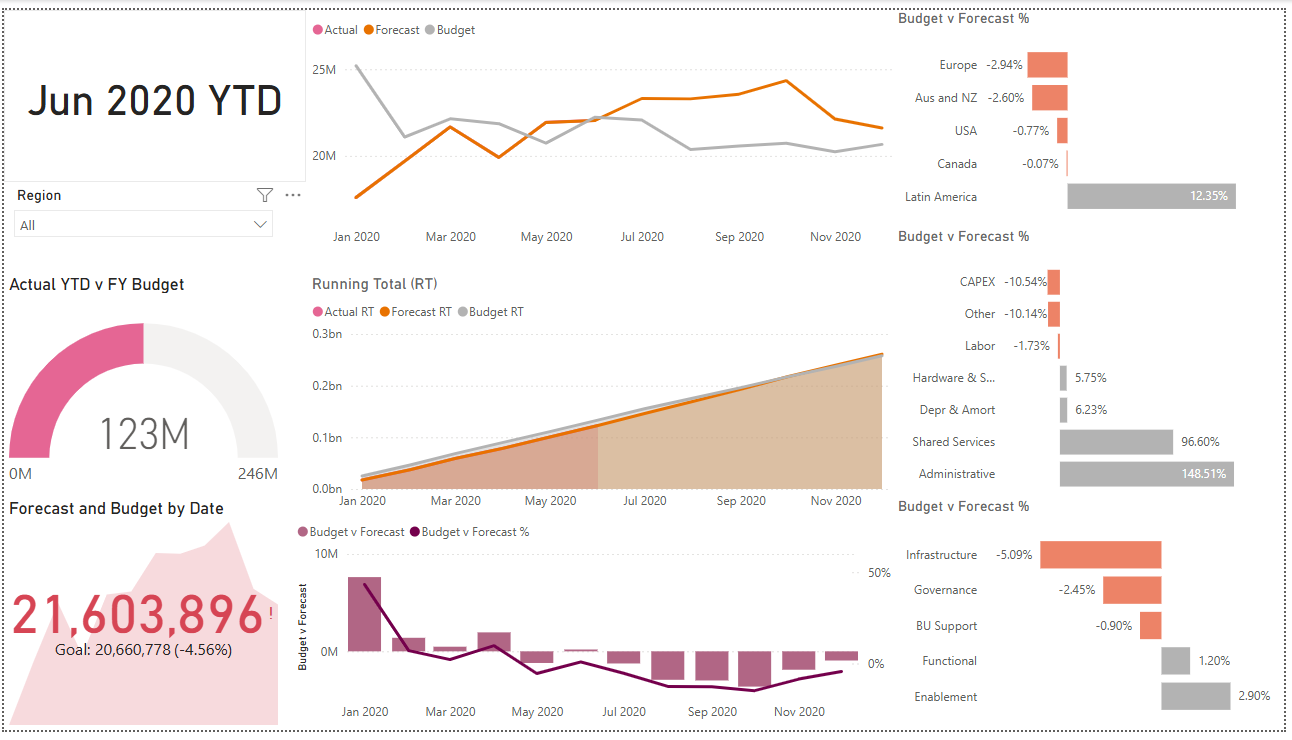
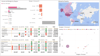
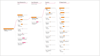
A professional IT Spend Dashboard built using Power BI, designed to provide clear visibility into IT costs and technology-related spending.
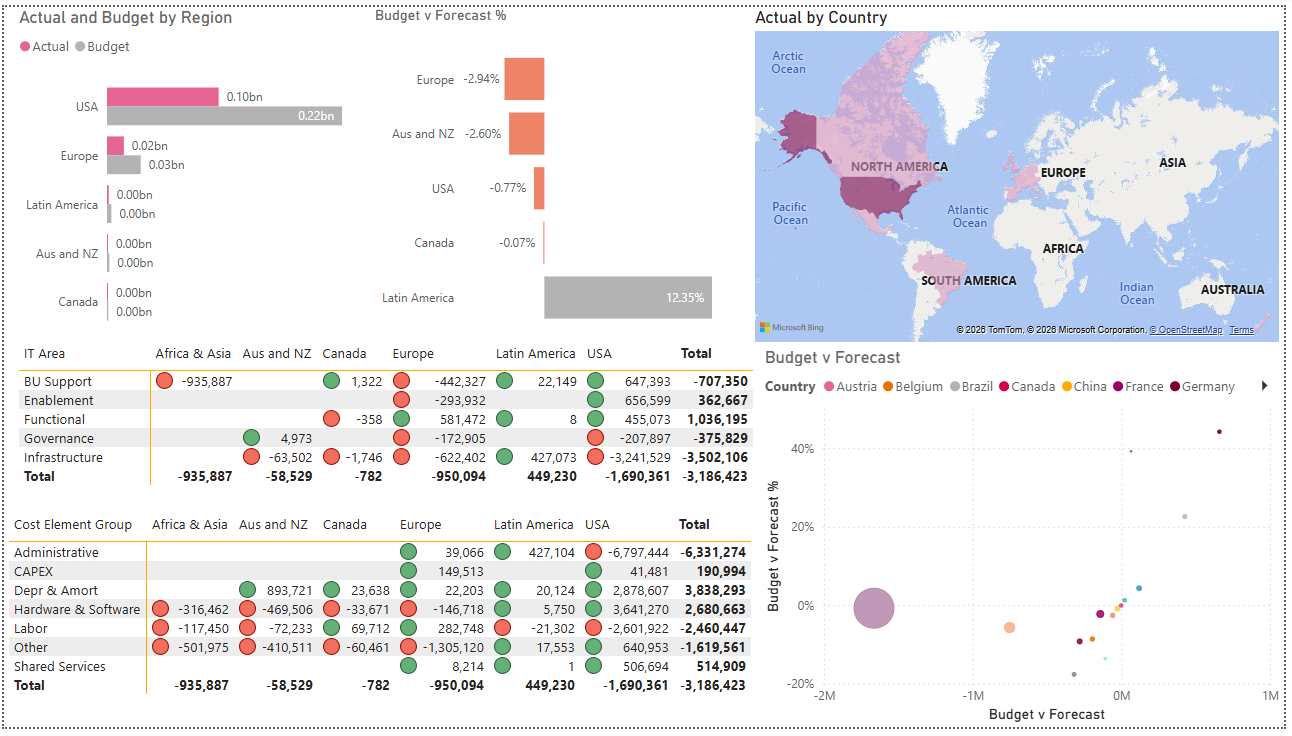
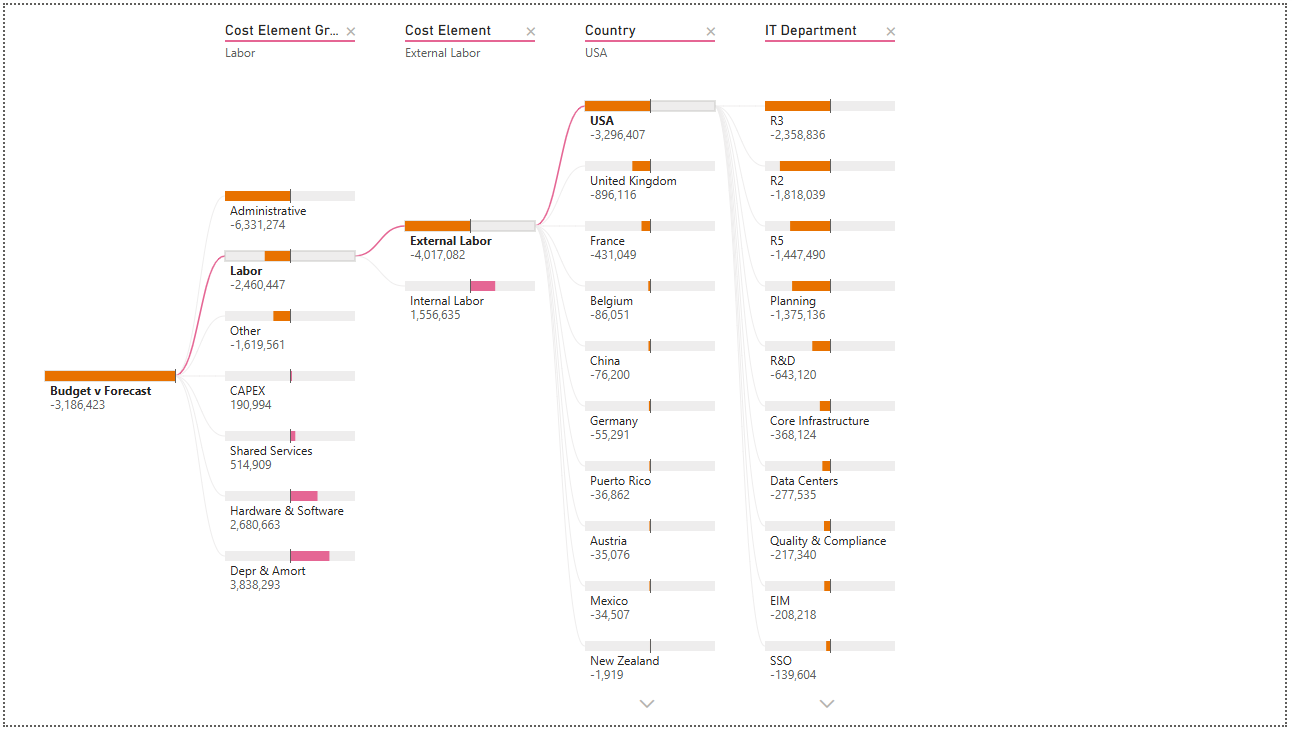
The dashboard highlights key metrics such as total IT spend, cost distribution by category, vendor analysis, budget vs actuals, and spending trends, all presented in a clean and executive-ready layout.
Ideal for IT managers, finance teams, and executives who need data-driven insights to optimize technology investments and control costs.
⭐ Key Features
- Total IT spend overview
- Cost breakdown by category & vendor
- Budget vs actual analysis
- Monthly & yearly spending trends
- Interactive Power BI visuals
🎯 Best For
- IT & finance reporting
- Cost control & budget management
- Technology investment analysis
- Power BI portfolios & digital products