


Handyman Business Profit Tracker
Handyman Business Profit Tracker Excel with job costing, a quote builder with markup pricing, expenses by category, and a monthly P and L dashboard. Know what every job actually made — and what every hour is worth.
Built for handymen, handywomen, and small repair contractors who price jobs by feel and want the numbers instead — without accounting software. If a job pays badly per hour, this workbook shows it before you quote the next one like it.
WHAT'S INCLUDED (6 sheets):
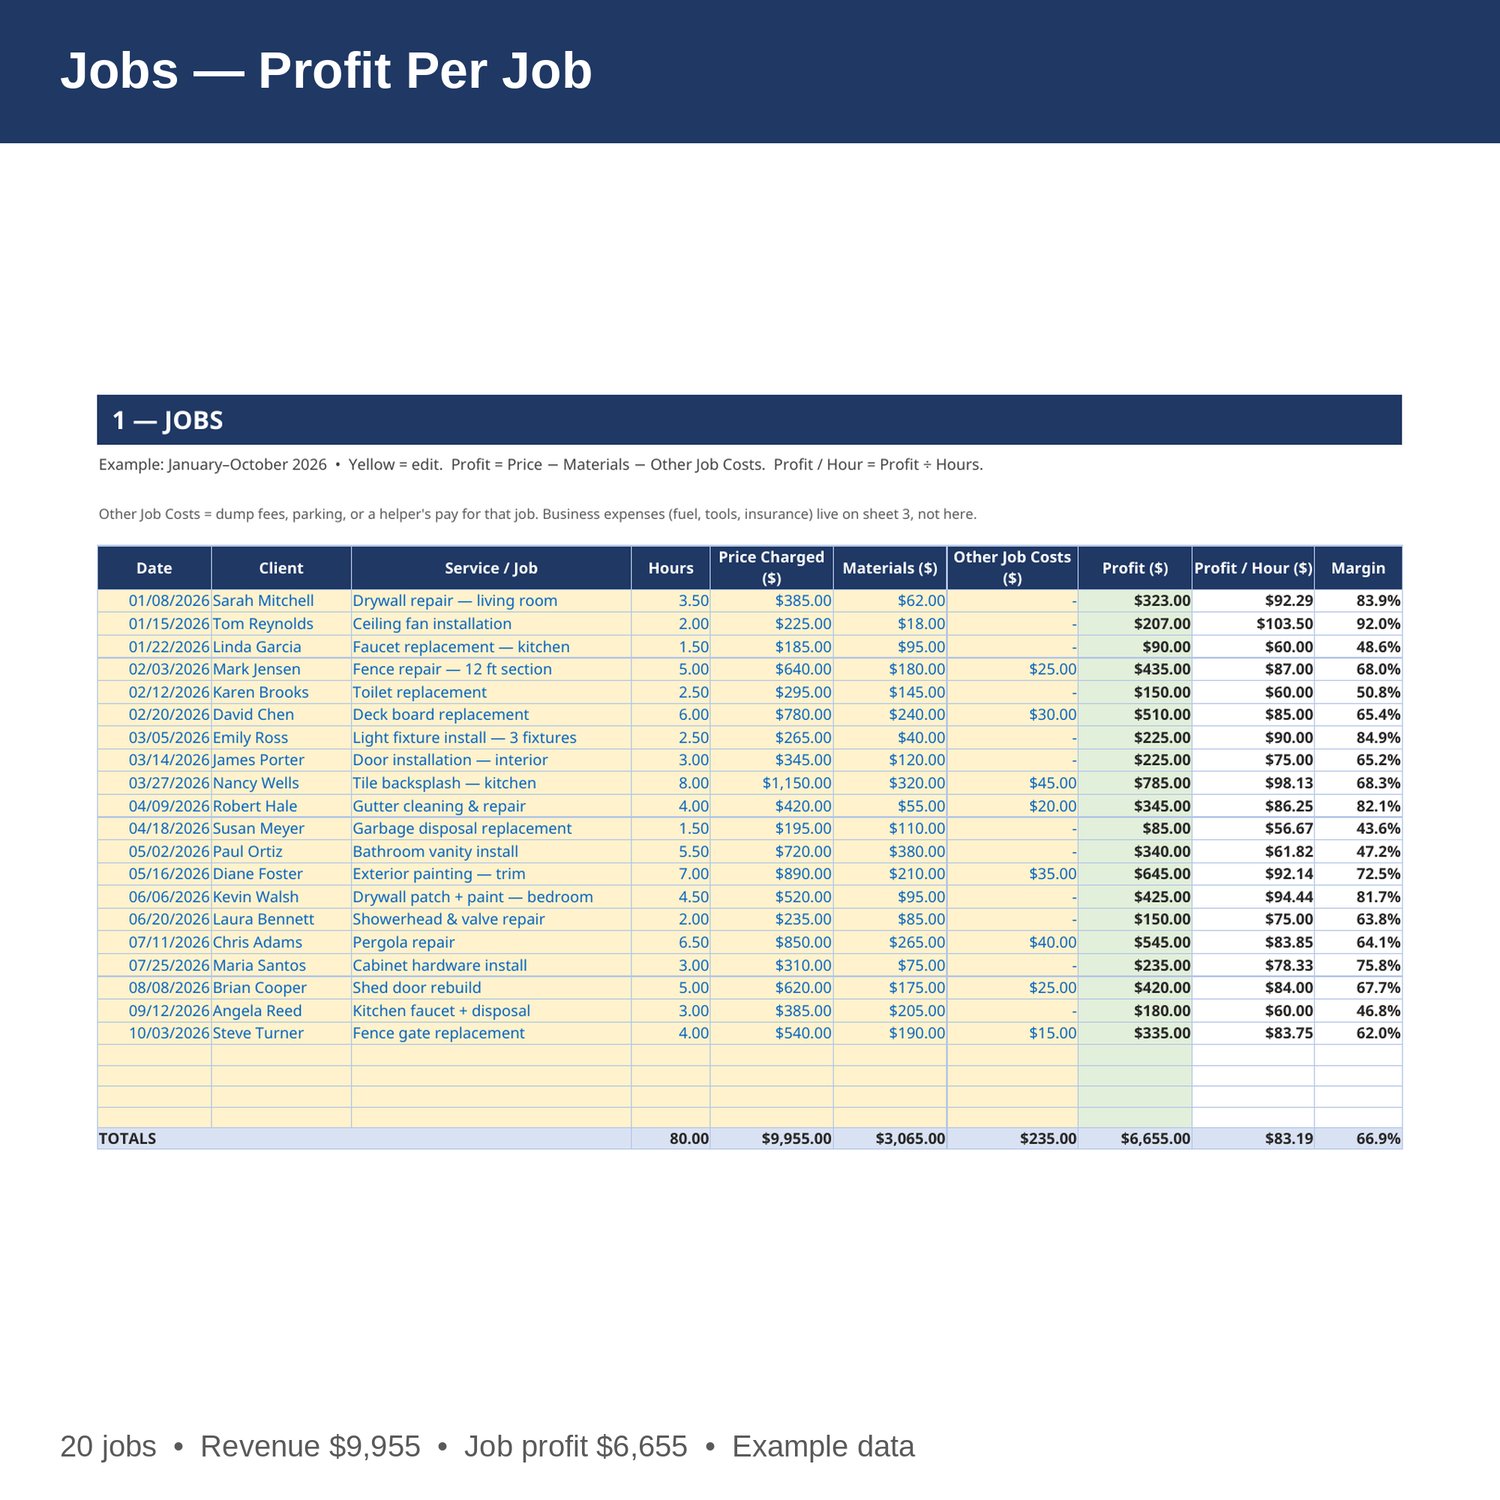
- Jobs — date, client, service, hours, price charged, materials, and other job costs (dump fees, parking, a helper's pay) for every job. Profit, profit per hour, and margin fill in by formula. Profit equals price minus materials minus other job costs.
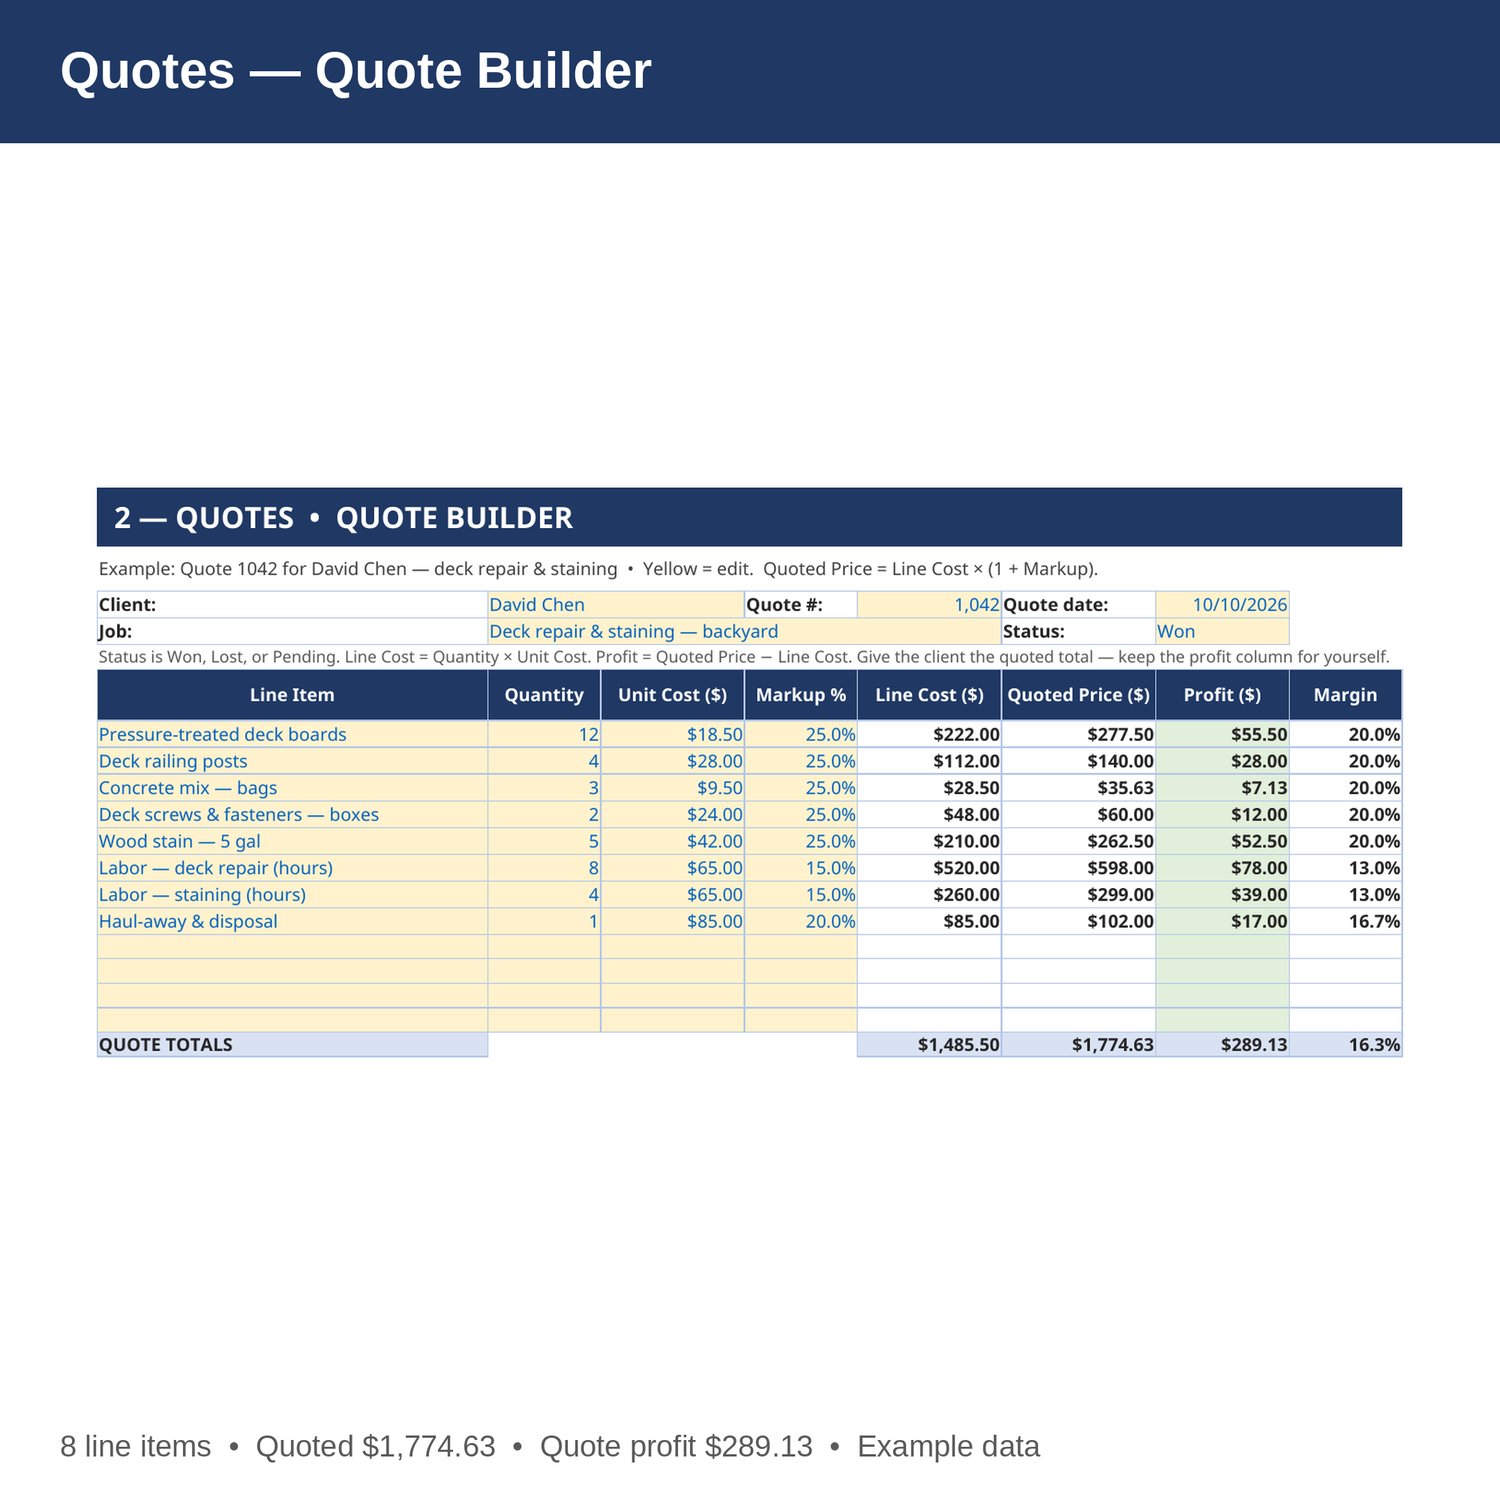
- Quotes — quote builder with line items, quantity, unit cost, and markup percent. Line cost, quoted price, and profit fill in by formula. Quoted price equals line cost times 1 plus markup. Set the client, quote number, date, and status (Won, Lost, or Pending) at the top. Give the client the quoted total — keep the profit column for yourself.
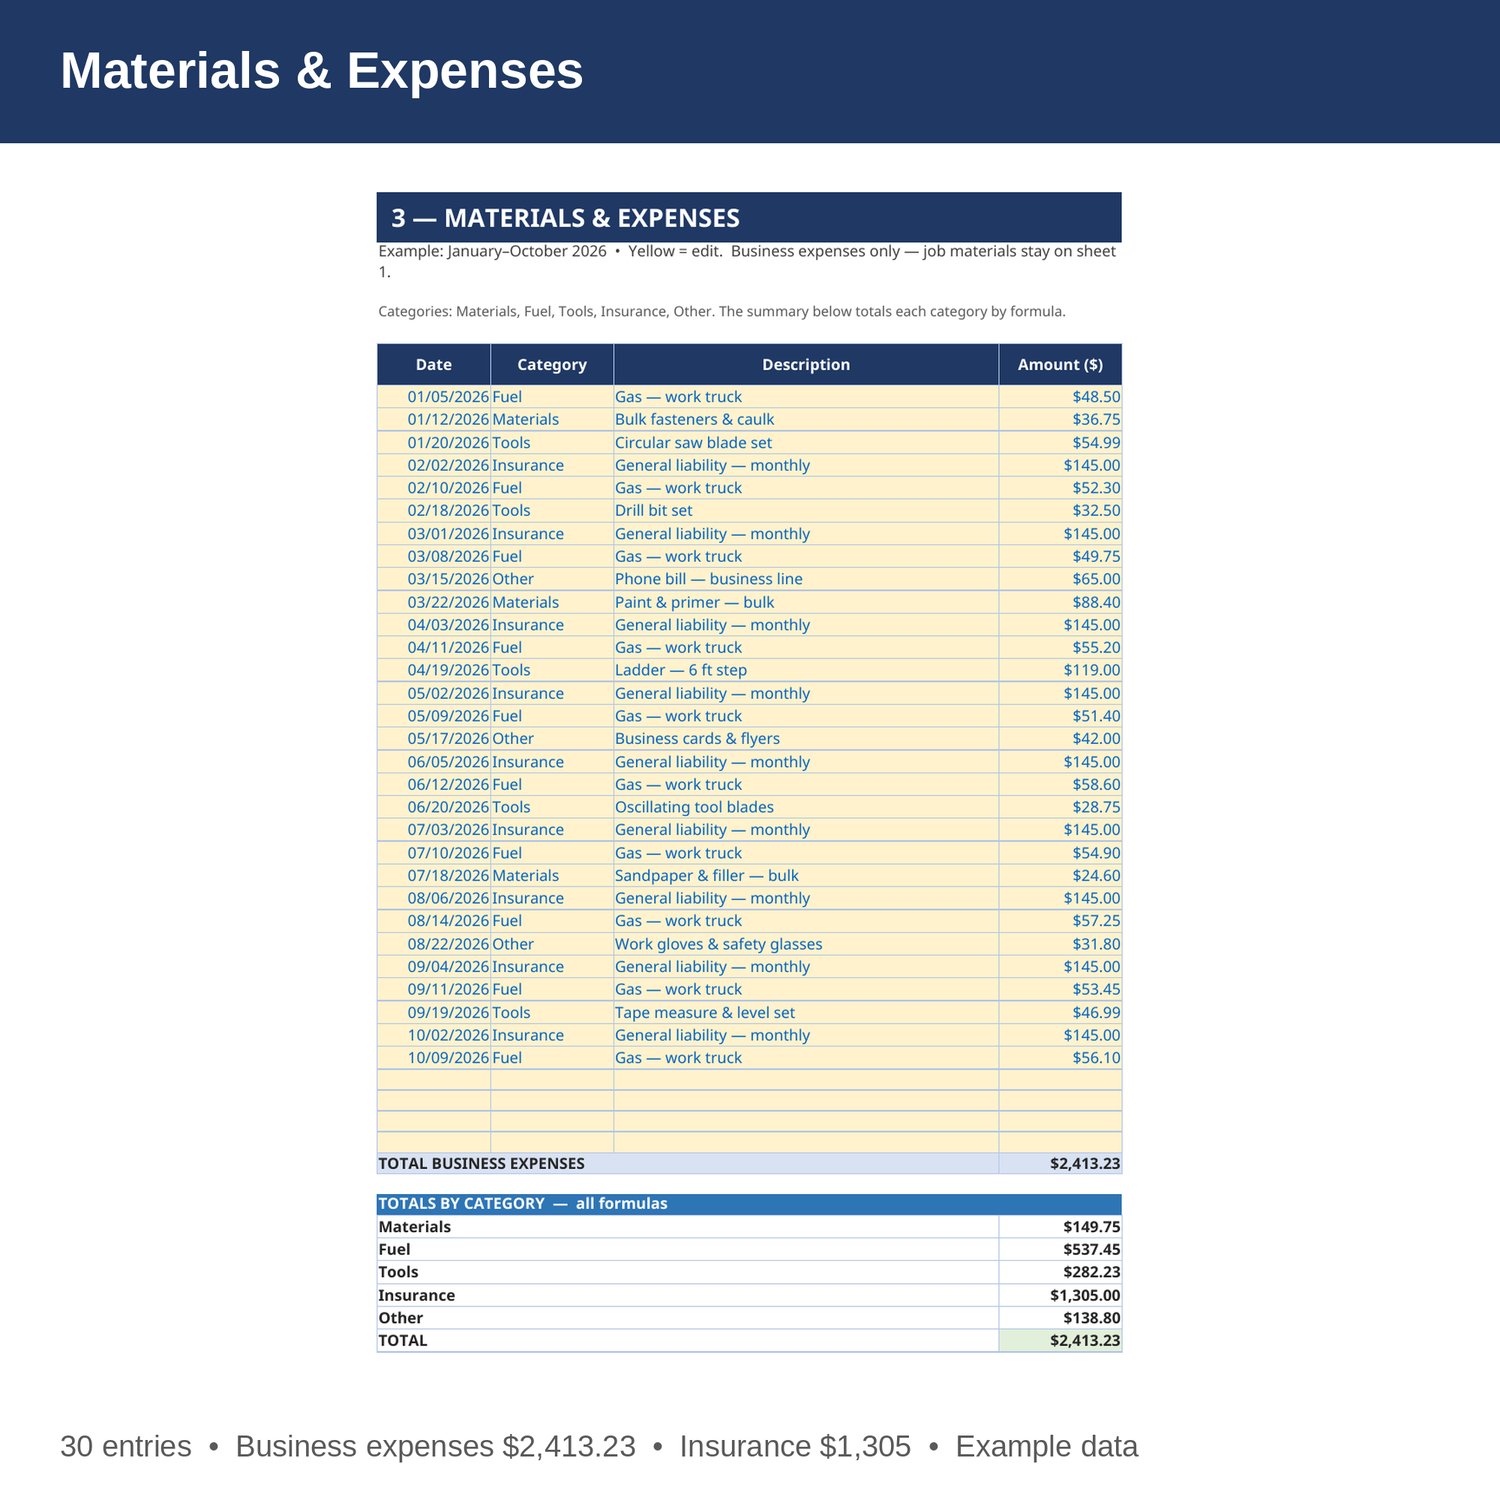
- Materials and Expenses — business expenses by category: Materials, Fuel, Tools, Insurance, Other. Job materials stay on the Jobs sheet, so nothing is counted twice. A totals-by-category summary sits below the log.
- Monthly P and L — jobs, hours, revenue, job costs, and business expenses by month, Jan-Dec, with net profit, margin, and profit per hour. All formulas from sheets 1 and 3.
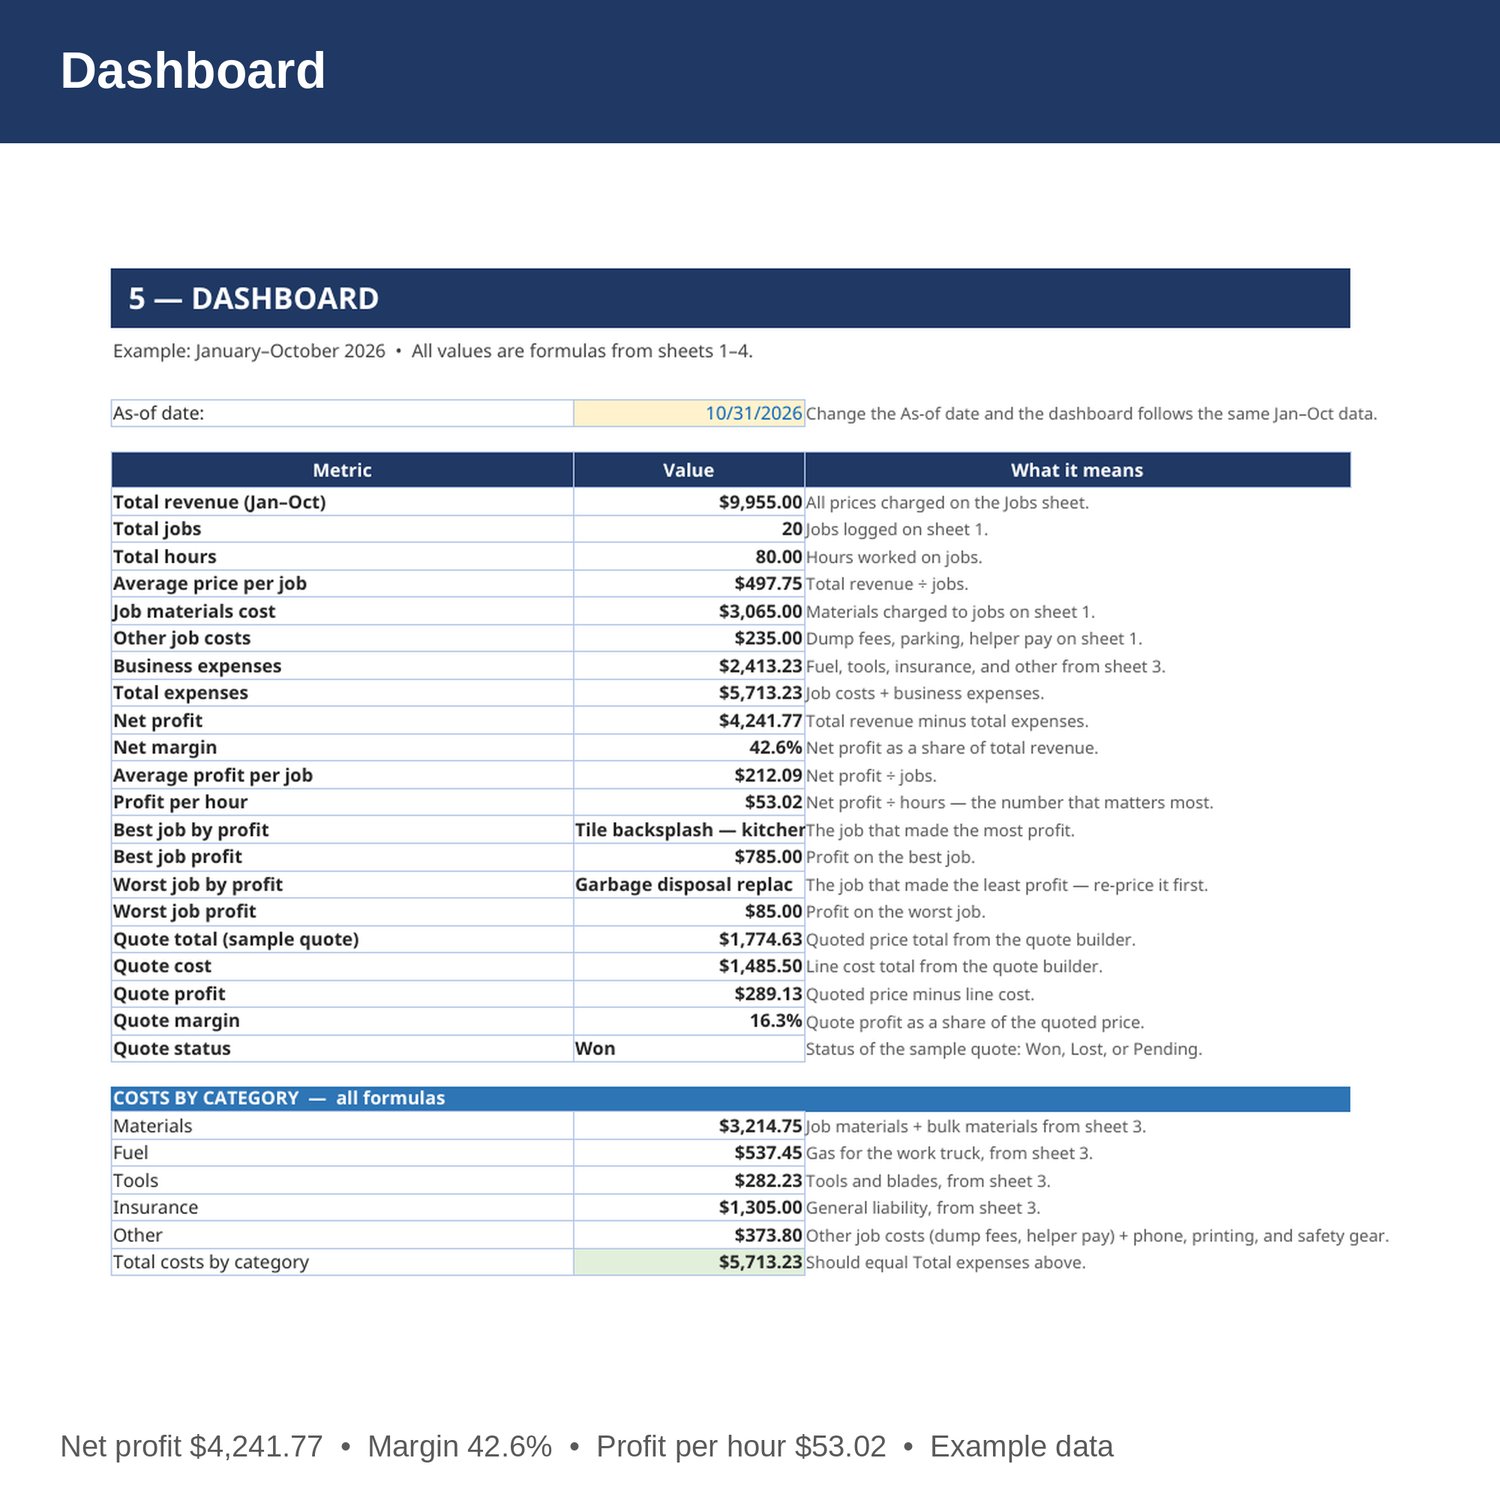
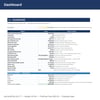
- Dashboard — total revenue, jobs, hours, expenses, net profit and margin, average profit per job, profit per hour, best and worst jobs, costs by category, and the sample quote summary.
- Cover and How to Use — start here. Yellow cells are the only ones you edit.
EXAMPLE DATA (January–October 2026 — replace with your own numbers):
- Total revenue 9,955 from 20 jobs and 80.00 hours; average price per job 497.75.
- Job materials 3,065, other job costs 235; job profit 6,655; job profit per hour 83.19.
- Business expenses 2,413.23: Materials 149.75, Fuel 537.45, Tools 282.23, Insurance 1,305.00, Other 138.80.
- Total expenses 5,713.23; net profit 4,241.77; margin 42.6 percent; average profit per job 212.09; profit per hour 53.02.
- Best job: Tile backsplash — kitchen, profit 785. Worst job: Garbage disposal replacement, profit 85.
- Sample quote (Quote 1042, deck repair and staining, status Won): line cost 1,485.50, quoted price 1,774.63, profit 289.13, margin 16.3 percent.
- Costs by category, all in: Materials 3,214.75, Fuel 537.45, Tools 282.23, Insurance 1,305.00, Other 373.80. The category total equals total expenses, 5,713.23.
HOW IT WORKS:
1. Download the Excel file instantly after purchase.
2. On sheet 1, log every job: date, client, service, hours, price charged, materials, and any other job costs. Profit, profit per hour, and margin fill in by formula.
3. On sheet 2, build a quote: enter each line item's quantity, unit cost, and markup percent. Quoted price equals line cost times 1 plus markup. Set the status to Won, Lost, or Pending when the client decides.
4. On sheet 3, log business expenses — fuel, tools, insurance, phone, bulk supplies — with a category. The P and L and Dashboard pull the category totals by formula.
5. Check profit per hour on the Dashboard. It is the number that matters most for a solo handyman: if a service pays badly per hour, raise the price or stop offering it.
HOW THE NUMBERS WORK:
Profit per job is price charged minus materials minus other job costs. Profit per hour is profit divided by hours — the Jobs sheet shows it before business expenses, and the P and L and Dashboard show it after all expenses. Net profit is total revenue minus job costs minus business expenses. Margin is net profit divided by total revenue. On the quote builder, line cost is quantity times unit cost, quoted price is line cost times 1 plus markup, and profit is quoted price minus line cost.
WHO IT'S FOR:
Handymen, handywomen, and small repair contractors who want job profit, quote pricing, expenses by category, and a monthly P and L in one workbook — without accounting software.
PLEASE NOTE:
- This is a digital download. No physical item will be shipped.
- Works in Microsoft Excel and Google Sheets (upload to Google Drive to open in Sheets).
- Example data for January–October 2026 is included (20 jobs, 1 sample quote, 30 expense entries). Replace it with your own numbers.
- The example covers January through October only, so November and December show zero on the P and L until you log jobs there.
- This is a bookkeeping and planning tool only, not tax, legal, or CPA advice.
- Due to the nature of digital downloads, refunds are not available. Message me before buying if you have a question.
Built by an accountant: B.S. Accountancy, ASU W. P. Carey, with revenue-reconciliation experience at Marriott and audit work at PwC.