


13-Week Dynamic Cash Flow Forecast & Liquidity Model
On Sale
$5.00
$5.00
The 13-Week Dynamic Cash Flow Forecast & Liquidity Model is an enterprise-grade financial modeling tool designed to give business leaders, CFOs, and finance teams complete visibility and control over short-term liquidity. Built from the ground up using financial modeling best practices, this fully dynamic model bridges the gap between top-line revenue performance and daily operational cash reality.
Whether you are managing working capital for a growing startup, navigating seasonal cash fluctuations, or optimizing vendor payment terms, this template provides the tools needed to foresee cash troughs, safeguard minimum liquidity buffers, and make data-driven financial decisions.
Key Features & Architecture
1. Centralized Model Drivers & Assumptions Tab
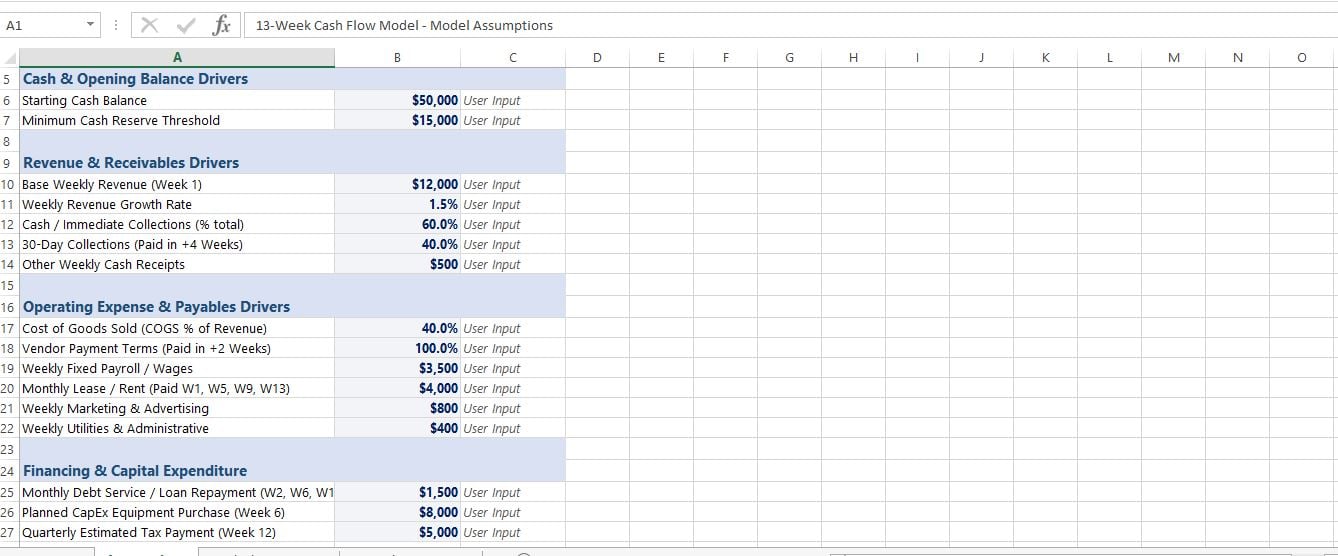
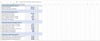
- 100% Dynamic Engine: Completely eliminates hardcoded values inside forecast calculations. All revenue growth rates, payment terms, payroll costs, and capital expenditures update automatically across the entire workbook when inputs change.
- Granular Working Capital Drivers: Model custom customer collection terms (e.g., immediate cash vs. 30-day AR lag), supplier/COGS payment schedules, recurring lease cycles, and scheduled capital outlays.
- Policy Safety Thresholds: Establish customized minimum cash reserve limits to instantly detect impending liquidity shortages.
2. 13-Week Rolling Cash Flow Forecast
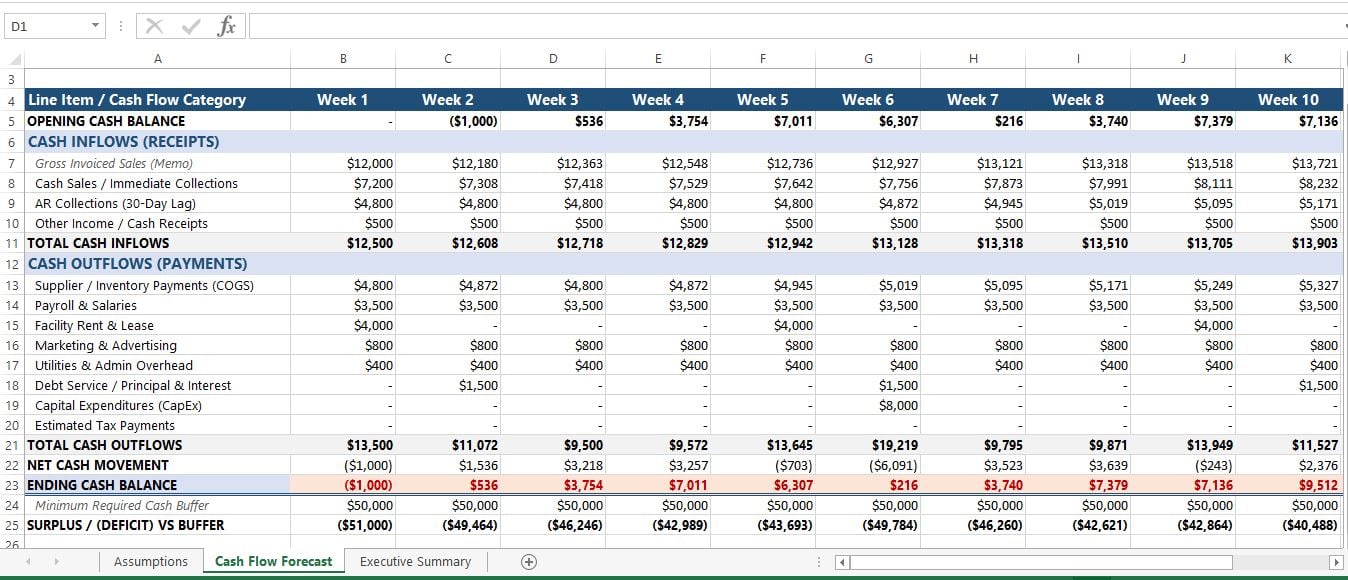
- Structured Cash Movement Grid: Clear logical separation between Opening Cash, Cash Inflows, Cash Outflows, Net Cash Movement, and Ending Cash Balance.
- Real-Time Automated Alerts: Built-in conditional formatting automatically highlights any week where cash drops below your safety buffer in a soft-red alert style.
- Full Period Aggregation: Dedicated 13-week summary columns track total cash generation and burn over the full fiscal quarter.
3. Executive Dashboard & Visual Trajectory
- High-Impact KPI Cards: At-a-glance monitoring of Starting Cash, Minimum Cash Trough (Lowest Point), Ending Cash, and Net 13-Week Cash Movement.
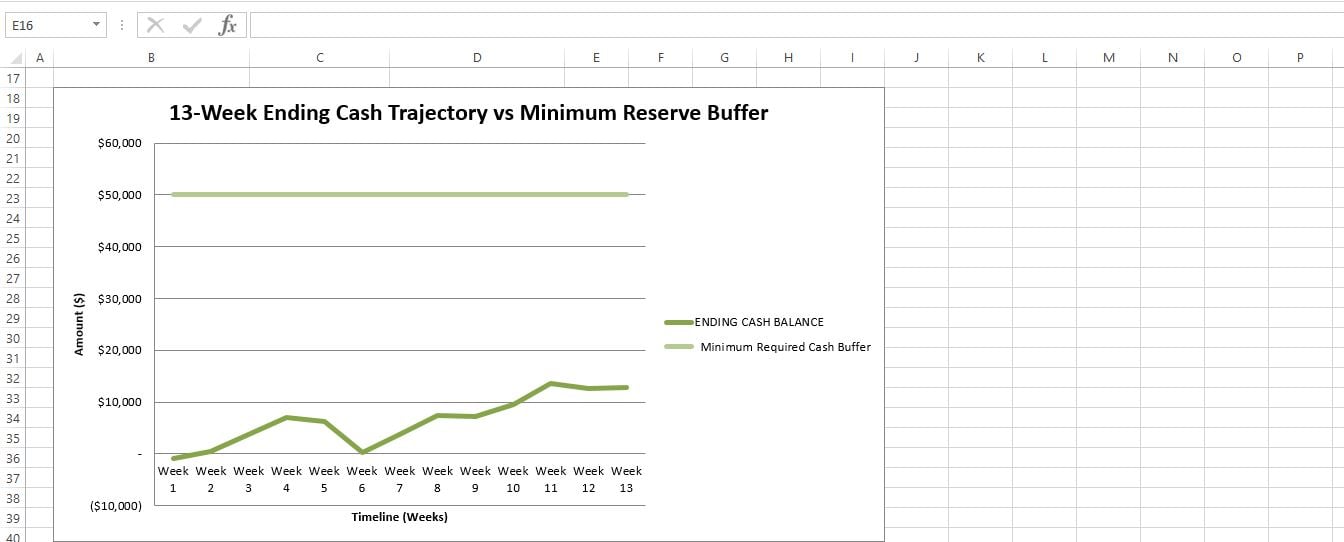
- Automated Risk Assessment: Dynamic identification of the exact week your cash hits its lowest point and calculation of remaining buffer headroom.
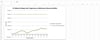
- Visual Liquidity Charting: Embedded trajectory chart plotting ending cash balances directly against your policy threshold line for executive presentations.
Who Is This For?
- Small & Medium Business Owners: Predict cash flow bottlenecks before they happen and ensure payroll and vendor obligations are consistently met.
- CFOs & Controllers: Maintain a robust short-term liquidity model for treasury management and board reporting.
- Finance Consultants & Advisors: Deliver a structured, turnkey cash management framework to clients.
- Startups & High-Growth Companies: Manage cash runway and optimize payment collection cycles during rapid scaling.
What’s Included?
- Format: Ready-to-use Microsoft Excel file (.xlsx).
- Structure: 3 linked tabs (Assumptions, Cash Flow Forecast, and Executive Summary).
- Formula Transparency: Standard Excel formulas (SUM, MIN, MATCH, AVERAGE, IF) with zero complex VBA scripts or external dependencies.