

HR Analytics Dashboard – HR Metrics, KPI Charts & Monthly Report (Excel + Word)
Turn your HR numbers into clear charts and a ready-made management report — in minutes, every month.
The HR Analytics Dashboard is built for HR managers, business owners and consultants who need to show leadership what’s happening with their people, without complicated software.
WHAT’S INSIDE
Excel workbook (works in Excel and Google Sheets)
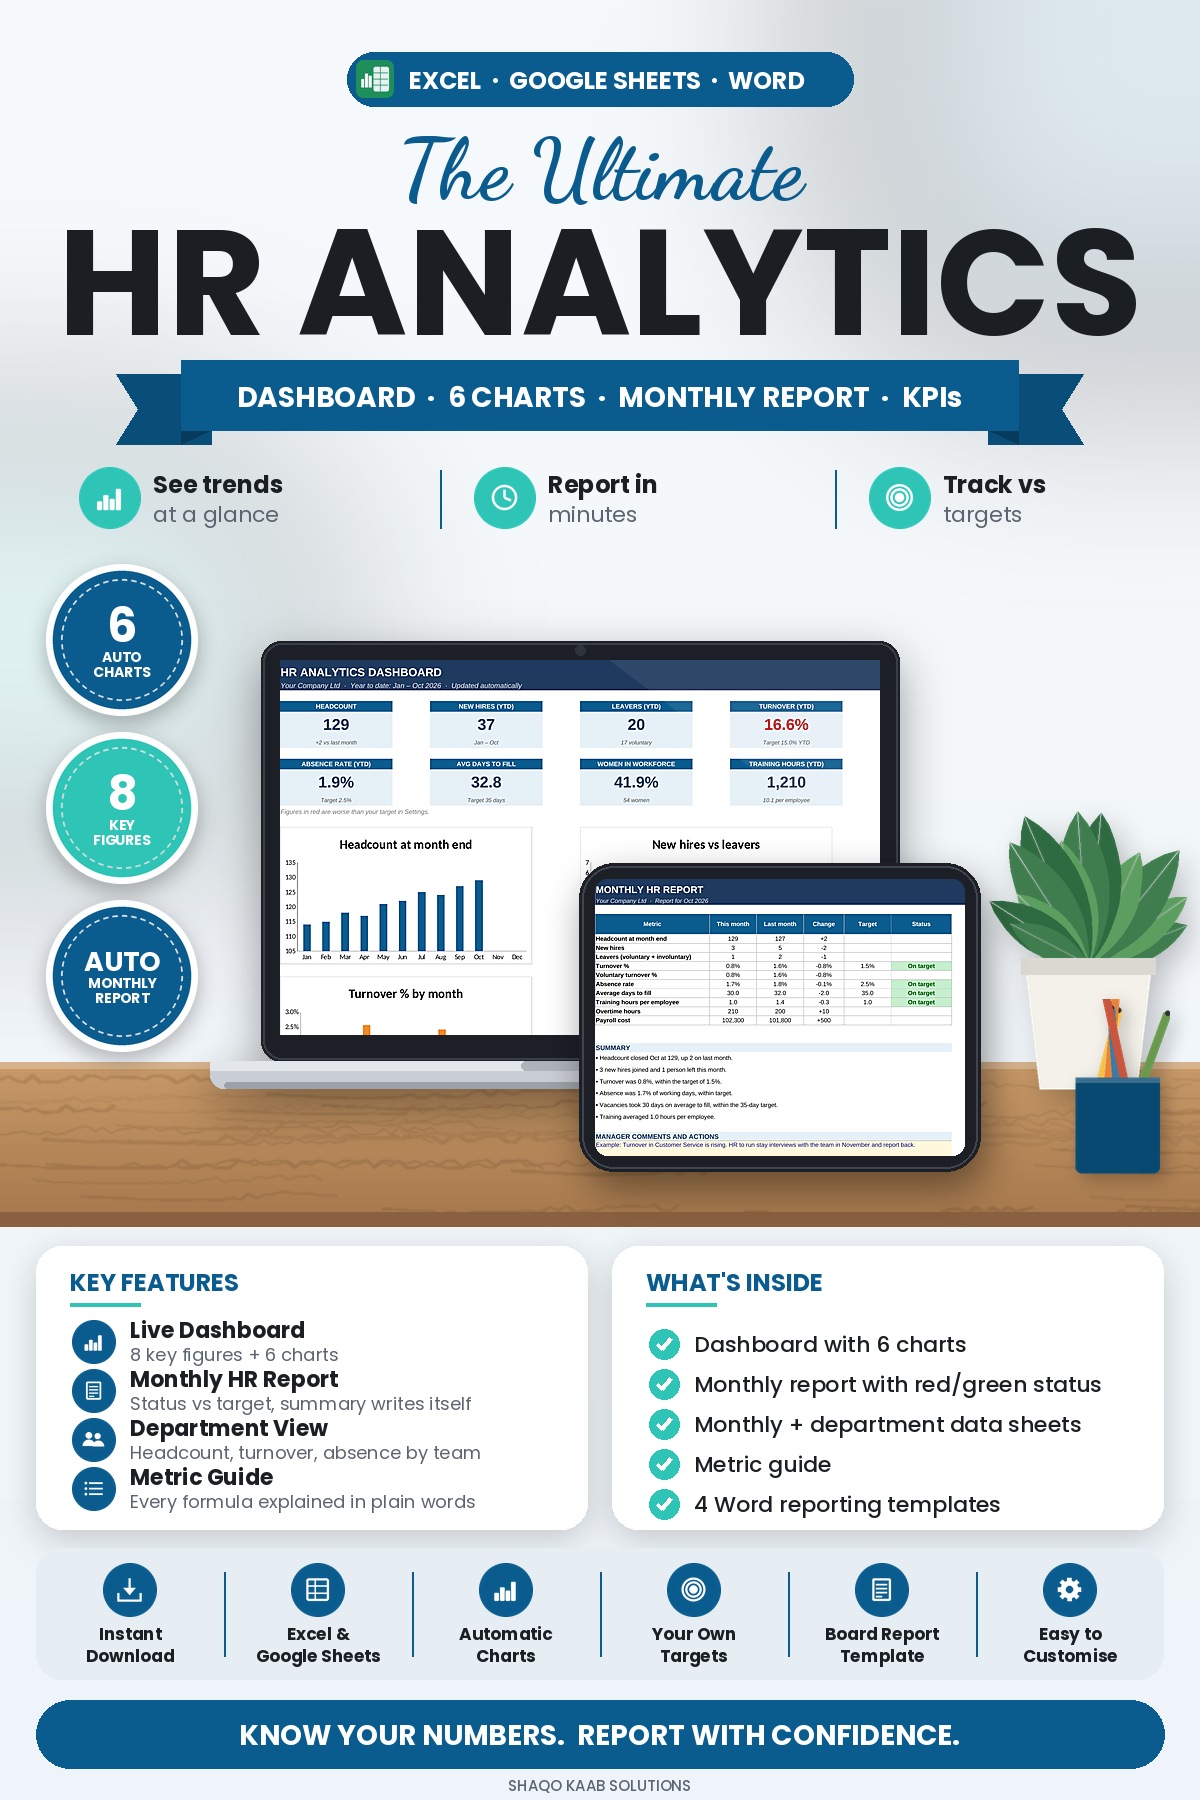
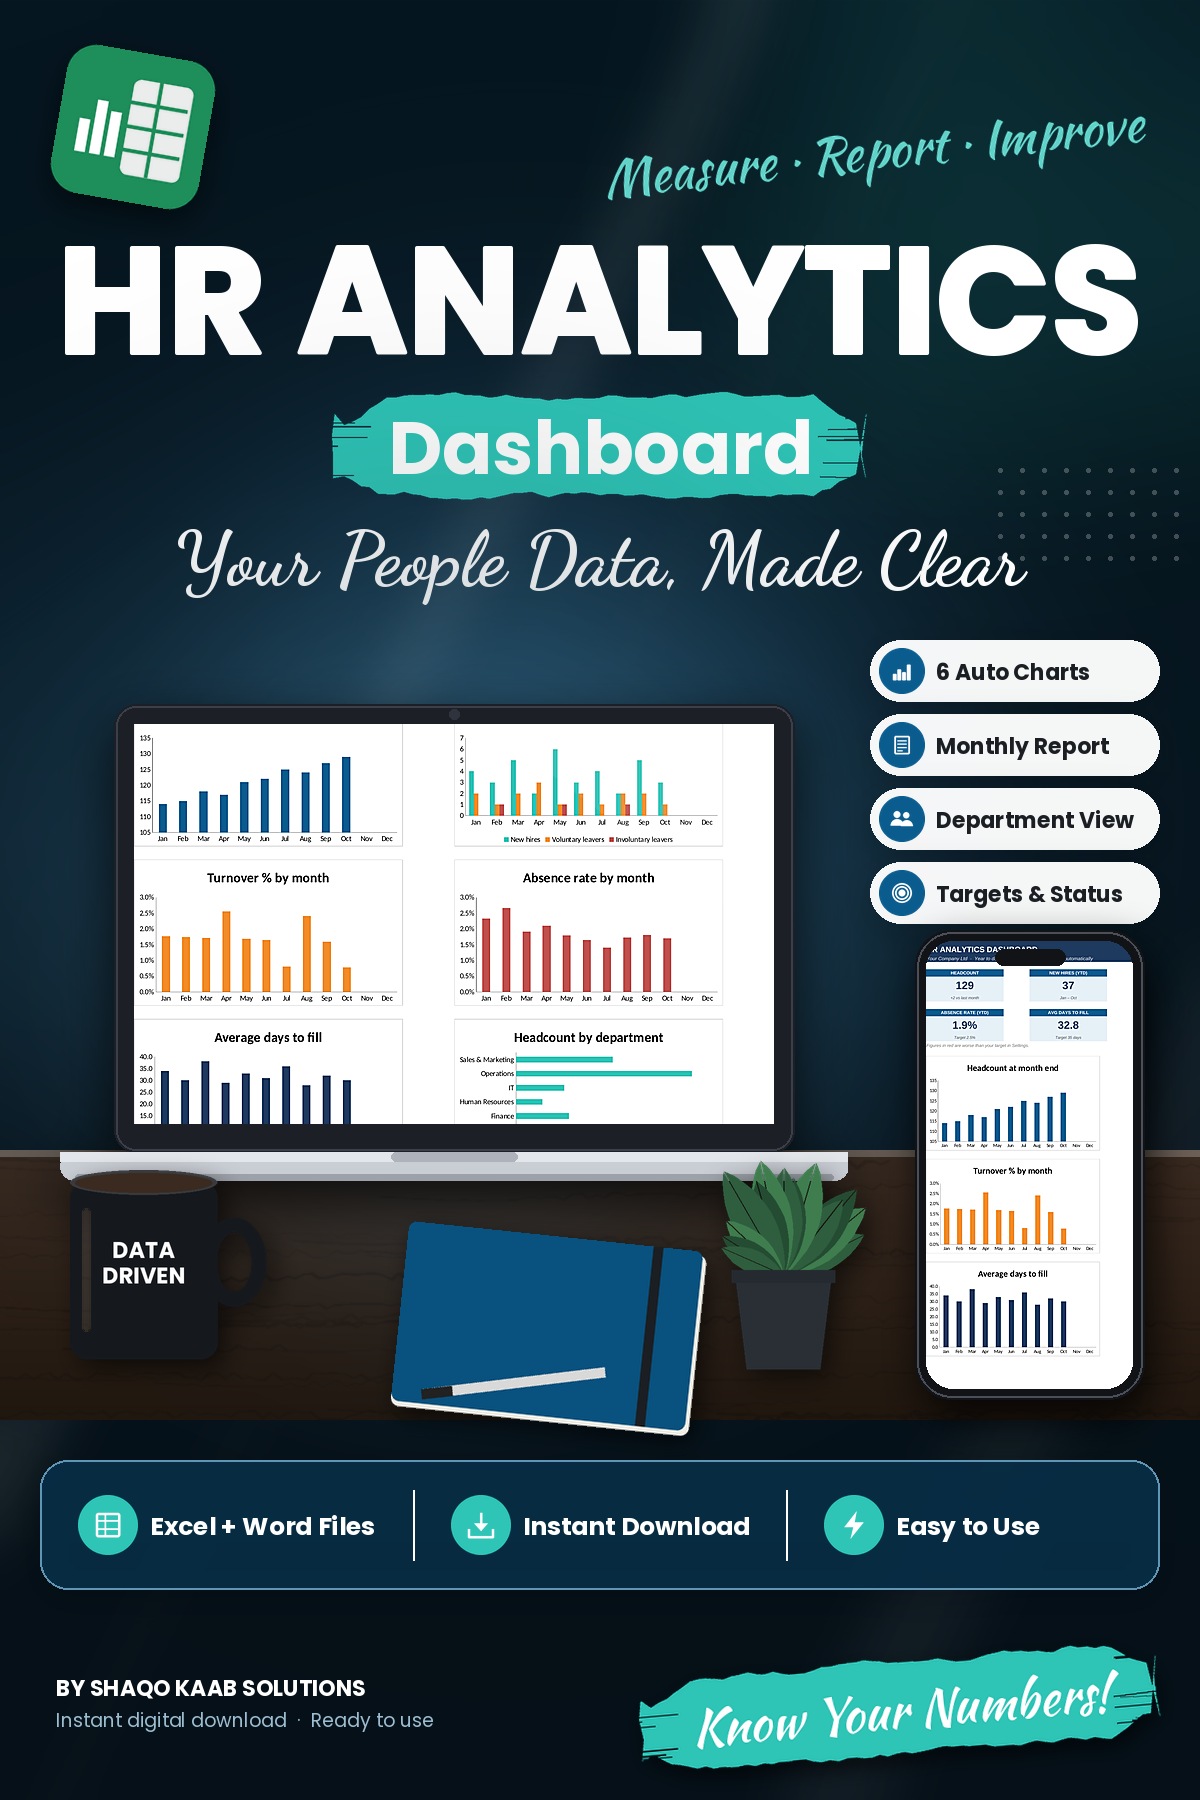
• Dashboard – 8 key figures and 6 charts that update automatically: headcount, hires vs leavers, turnover, absence rate, time to fill and headcount by department
• Monthly HR Report – this month vs last month vs target, with red/green status and summary sentences that write themselves
• Monthly Data – enter a few numbers each month; headcount, turnover, absence rate, time to fill and training hours per employee are calculated for you
• Department Data – headcount, % women, turnover and absence by department, with an automatic headcount check
• Metric Guide – every metric explained in plain words, with the formula used
• Your own targets – set targets for turnover, absence, time to fill and training; figures turn red when off target
• Blank and example versions included
Word templates (4)
- Monthly HR report to management
- Quarterly HR report to the board
- HR metrics glossary (20 metrics with formulas)
- Monthly HR data collection checklist
WHY YOU’LL LOVE IT
✓ Professional HR reporting without expensive software
✓ Spot turnover and absence problems early
✓ Impress management and boards with clear, visual data
✓ Fully editable, with your own departments and targets
Instant digital download. For use within one organization.
Created by Shaqo Kaab Solutions