
LAYERS FARM FINANCIAL PLANNER - Excel Spreadsheet | Track Sales, Expenses & Profit (KES)
The complete financial management tool built specifically for layers farmers in Kenya.
Stop guessing your profits. Start tracking every shilling automatically.
Are You Running Your Layers Farm Without Knowing If You Are Actually Making Money?
Most small-scale layers farmers in Kenya track expenses in notebooks, estimate profits in their heads, and only realize they are losing money when the bank account runs dry. If this sounds familiar, this planner was built for you.
The Layers Farm Financial Planner is a ready-to-use Excel spreadsheet that gives you a complete financial picture of your farm - from the day you make your first investment to the moment your birds start laying. Every shilling you spend and every shilling you earn is tracked automatically, summarized by category and month, and displayed on a professional dashboard with charts.
You enter your transactions once. The planner does everything else.
What Is Inside the Planner
The planner contains 4 professionally designed sheets that work together automatically:
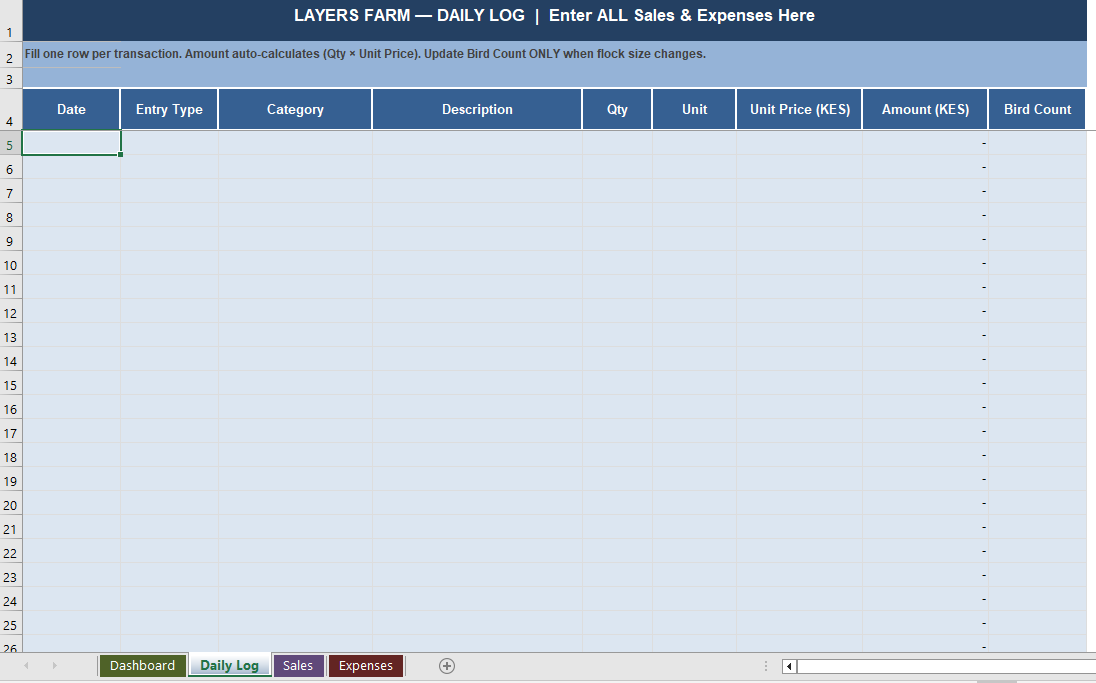
1. Daily Log — Your Only Data Entry Point.
This is the one sheet you fill in daily. Every sale and every expense gets one row. Enter the date, select the type, pick the category, enter the quantity and price — the amount calculates itself. That is all you do. Everything else in the planner updates automatically from this single sheet.
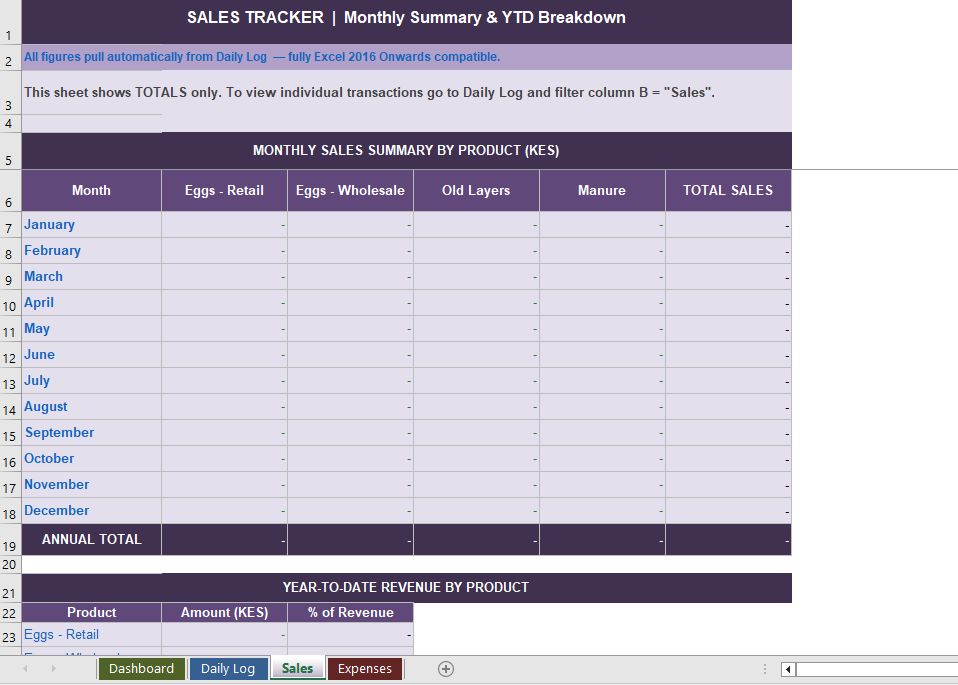
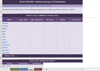
2. Sales Tracker.
Automatically summarizes all your sales by product and by month. See exactly how much revenue came from Eggs (Retail), Eggs (Wholesale), Old Layers, and Manure - for every month of the year. Includes a Year-to-Date revenue breakdown showing which product earns you the most.
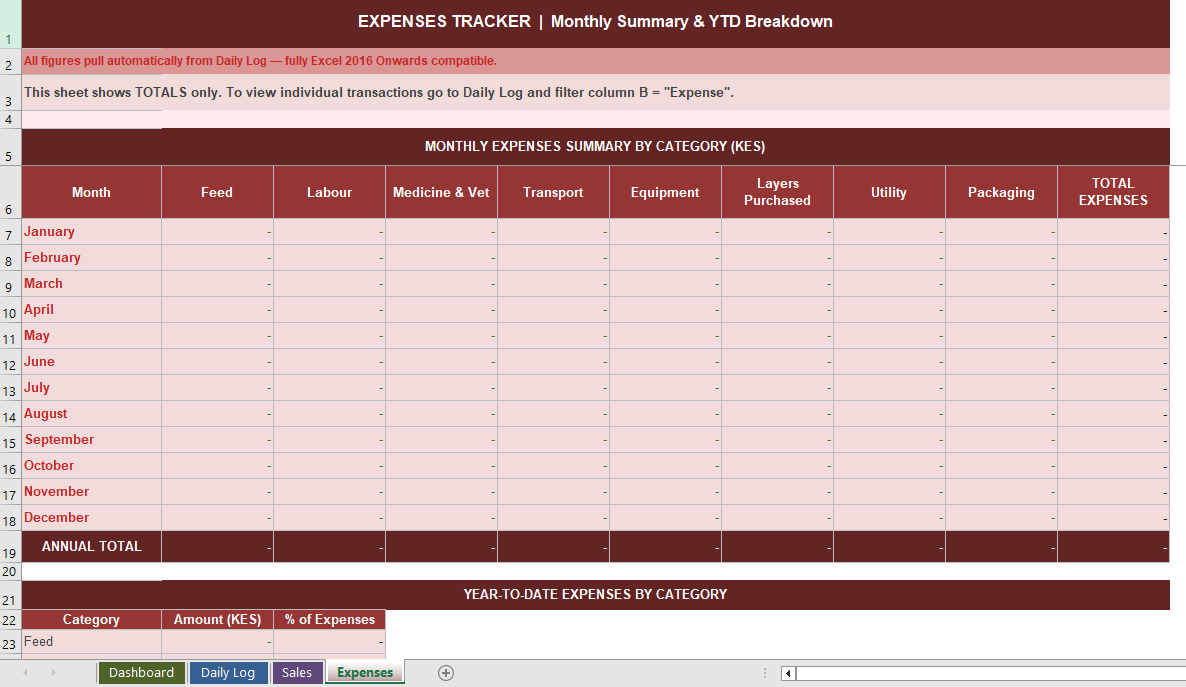
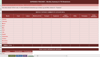
3. Expenses Tracker.
Automatically summarises all your expenses by category and by month. Track Feed, Labour, Medicine & Vet, Transport, Equipment, Layers Purchased, Utility, and Packaging costs separately — so you always know exactly where your money is going.
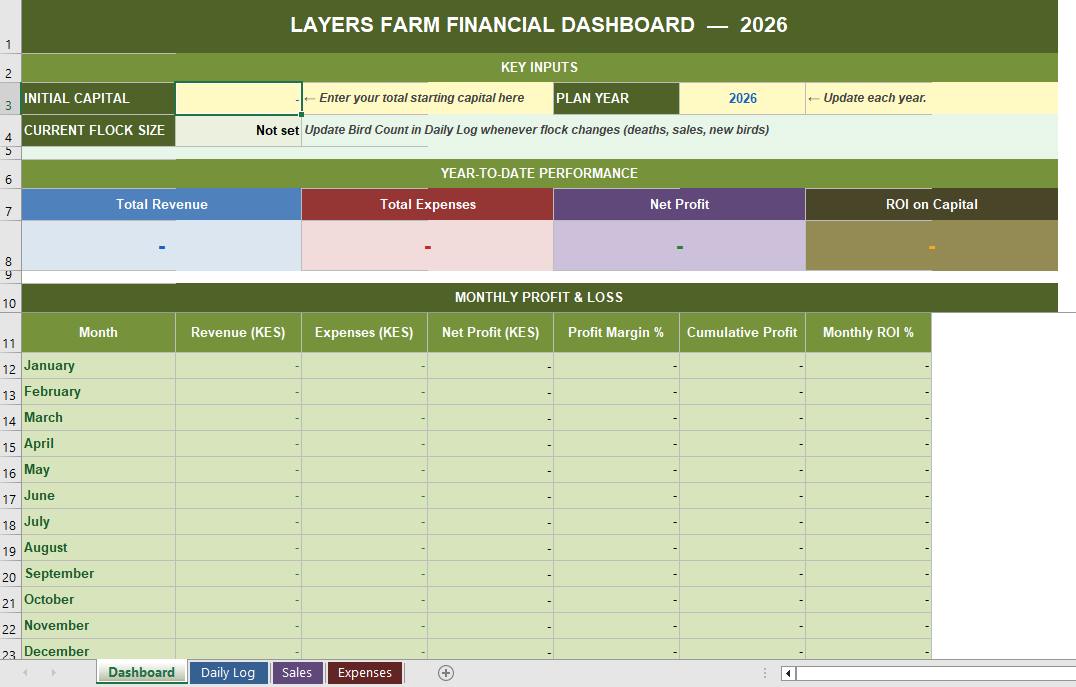
4. Financial Dashboard.
Your command centre. At a glance, see:
Total Revenue earned to date
Total Expenses spent to date
Net Profit or Loss
Return on Investment (ROI) against your starting capital
Full January to December Profit & Loss table
Profit margin and cumulative profit for every month
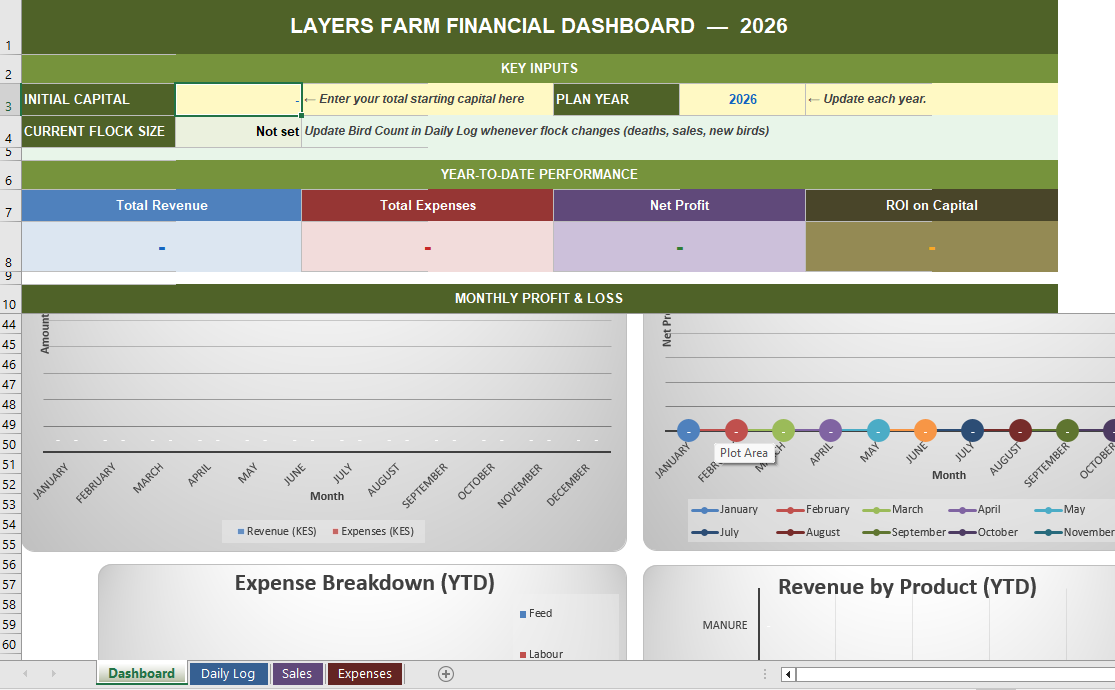
4 automatic charts — Revenue vs Expenses, Net Profit Trend, Expense Breakdown, Revenue by Product.
Key Features
- Fully automatic — enter data in the Daily Log and all other sheets update instantly.
- Built for Kenyan layers farmers — currency in KES, categories match real farm operations.
- Covers the full business cycle — from initial investment and construction through stocking with chicks to first egg sales and beyond.
- Tracks all income streams — Eggs (Retail), Eggs (Wholesale), Old Layers for meat, Manure.
- Tracks all expense categories — Feed, Labour, Medicine & Vet, Transport, Equipment, Layers Purchased, Utility, Packaging.
- ROI Calculator — shows your return on investment against initial capital updated in real time.
- Flock Size Tracker — records and displays your current bird count automatically as it changes over time.
- Monthly and Annual summaries — see performance for any single month or the full year.
- 4 Professional Charts — visual dashboards that update automatically with your data.
- Sheet protection built in — formula sheets are locked to prevent accidental editing. Only the Daily Log is open for entry.
- 500 transaction rows — enough capacity for daily entries across a full year of operations.
- Compatible with Excel 2016 and all newer versions including Excel 2019, 2021, 2026, and Microsoft 365
Who This Is For:
This planner is designed for:
- New layers farmers starting from scratch who want to track every investment from day one.
- Existing farmers who are currently tracking expenses in notebooks and want to move to a proper system.
- Small to medium operations running between 50 and 1,000 birds.
- Anyone who wants to know their real profit — not estimates — at any point in the year.
How It Works — Step by Step
Step 1 — Open the Dashboard and enter your starting capital and the current year. That takes 5 seconds.
Step 2 — Every time you spend money or earn money, open the Daily Log and fill one row. Select your category from the dropdown menu. Enter the quantity and price. The amount fills itself.
Step 3 — Switch to the Dashboard any time to see your full financial picture — revenue, expenses, profit, ROI, and charts — all updated automatically.
That is the entire workflow. No accounting knowledge required. No formulas to write. No calculations to do manually.
Included in Your Download.
- 1* Excel File (.xlsx) - Ready to use immediately
- Compatible with Excel 2016, 2019,2021,2026 and Microsoft 365
- Works on Windows PC and Laptop.
- All sheets are pre-formatted and formula protected.