








Pivot Points Is The Way
The market told you where it would turn. You just could not read it.
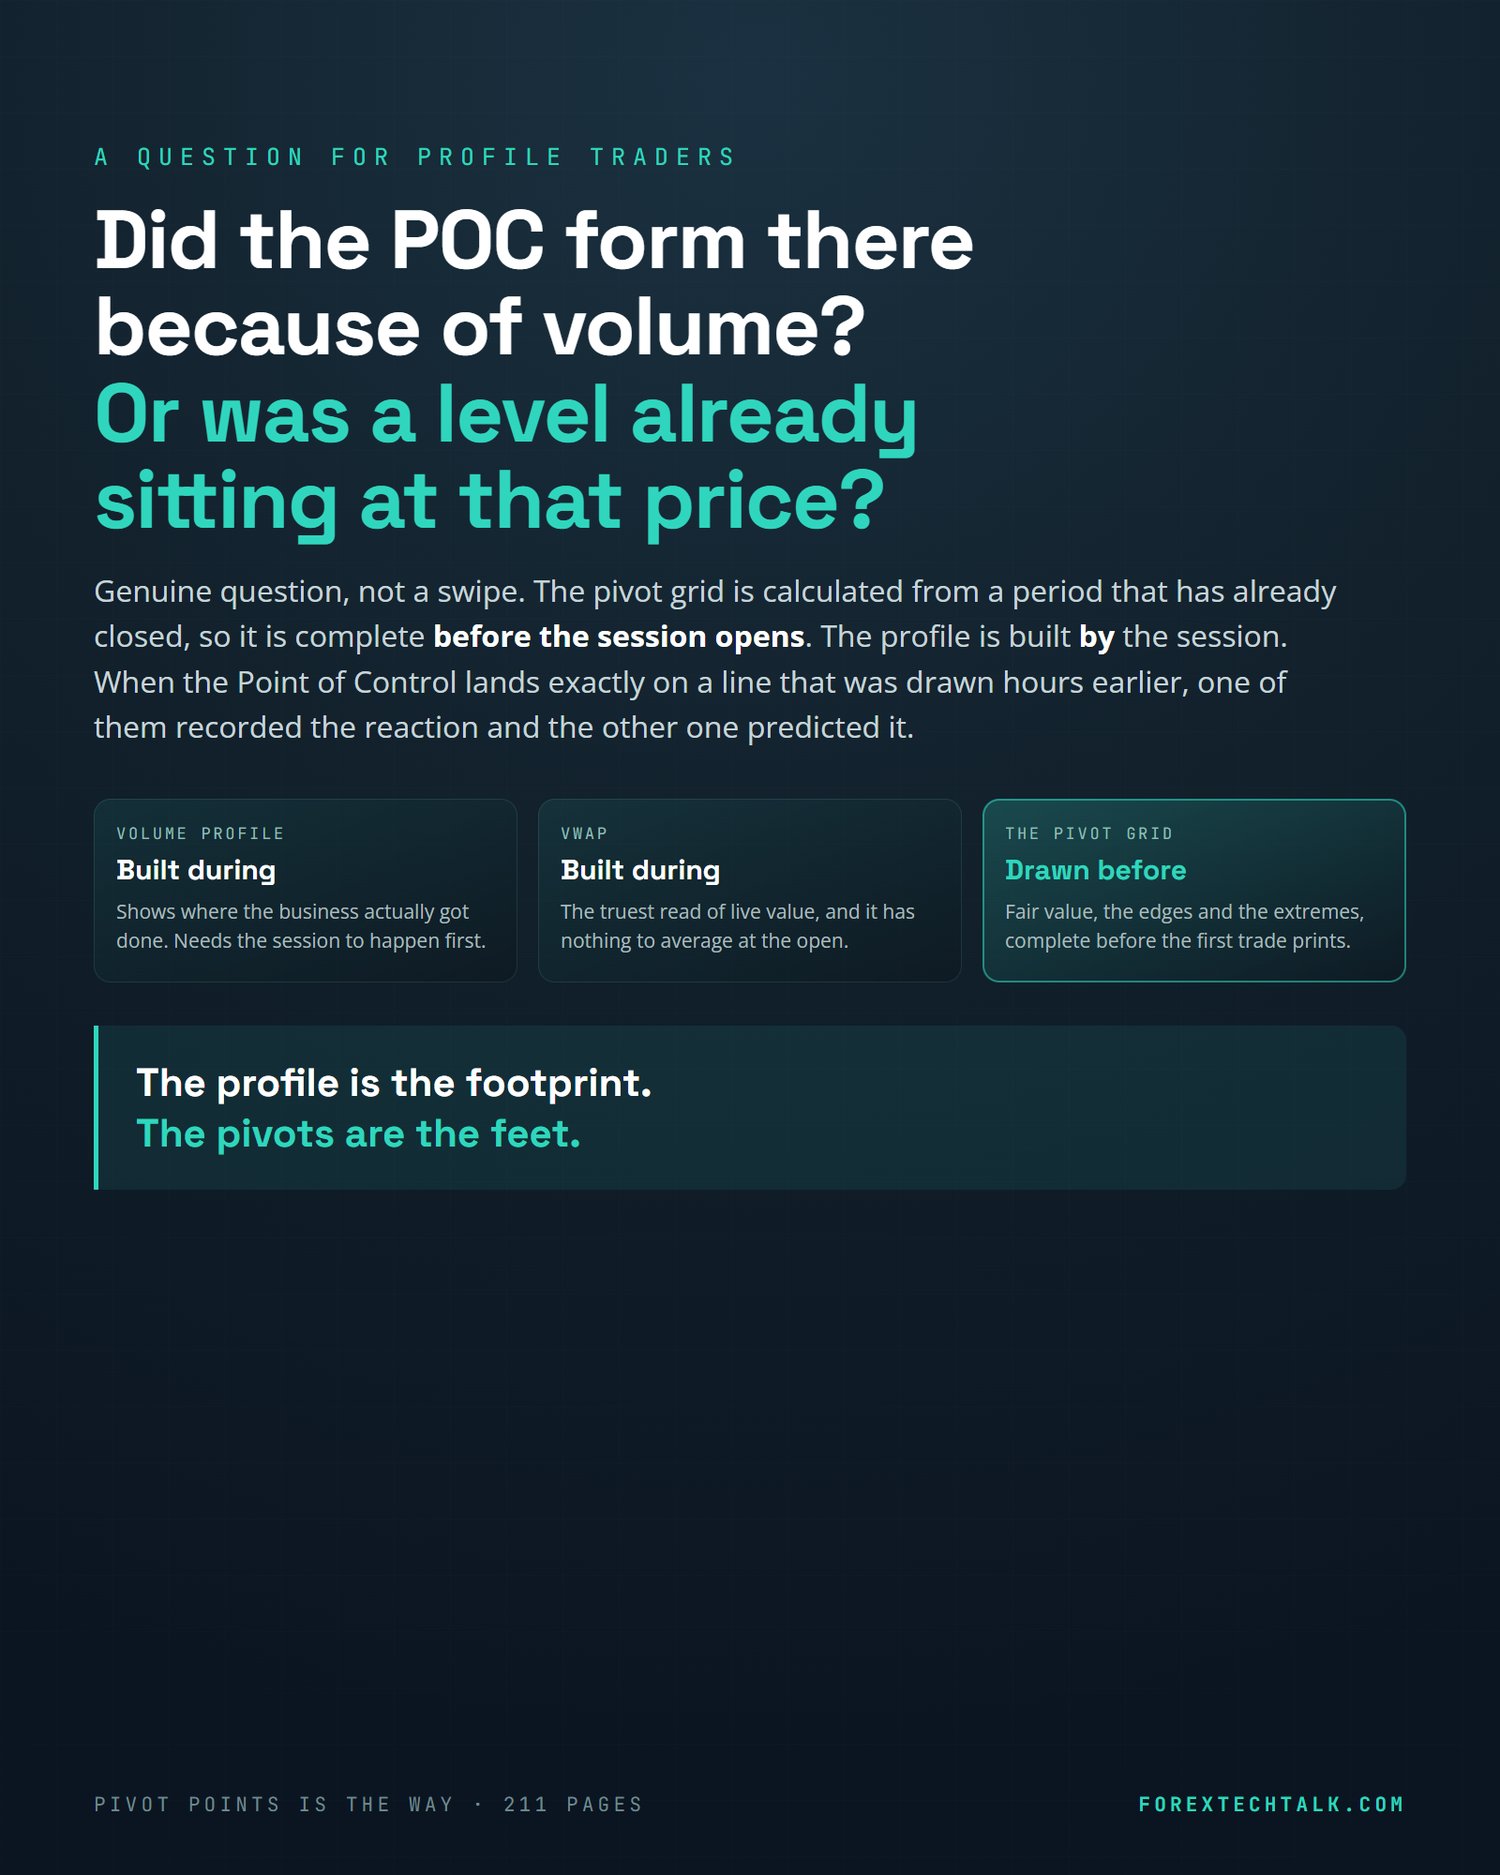
Not a prediction. Not a pattern someone found after the fact. A grid of levels calculated from the previous period's high, low and close, sitting on the chart before the session opened, waiting for price to arrive.
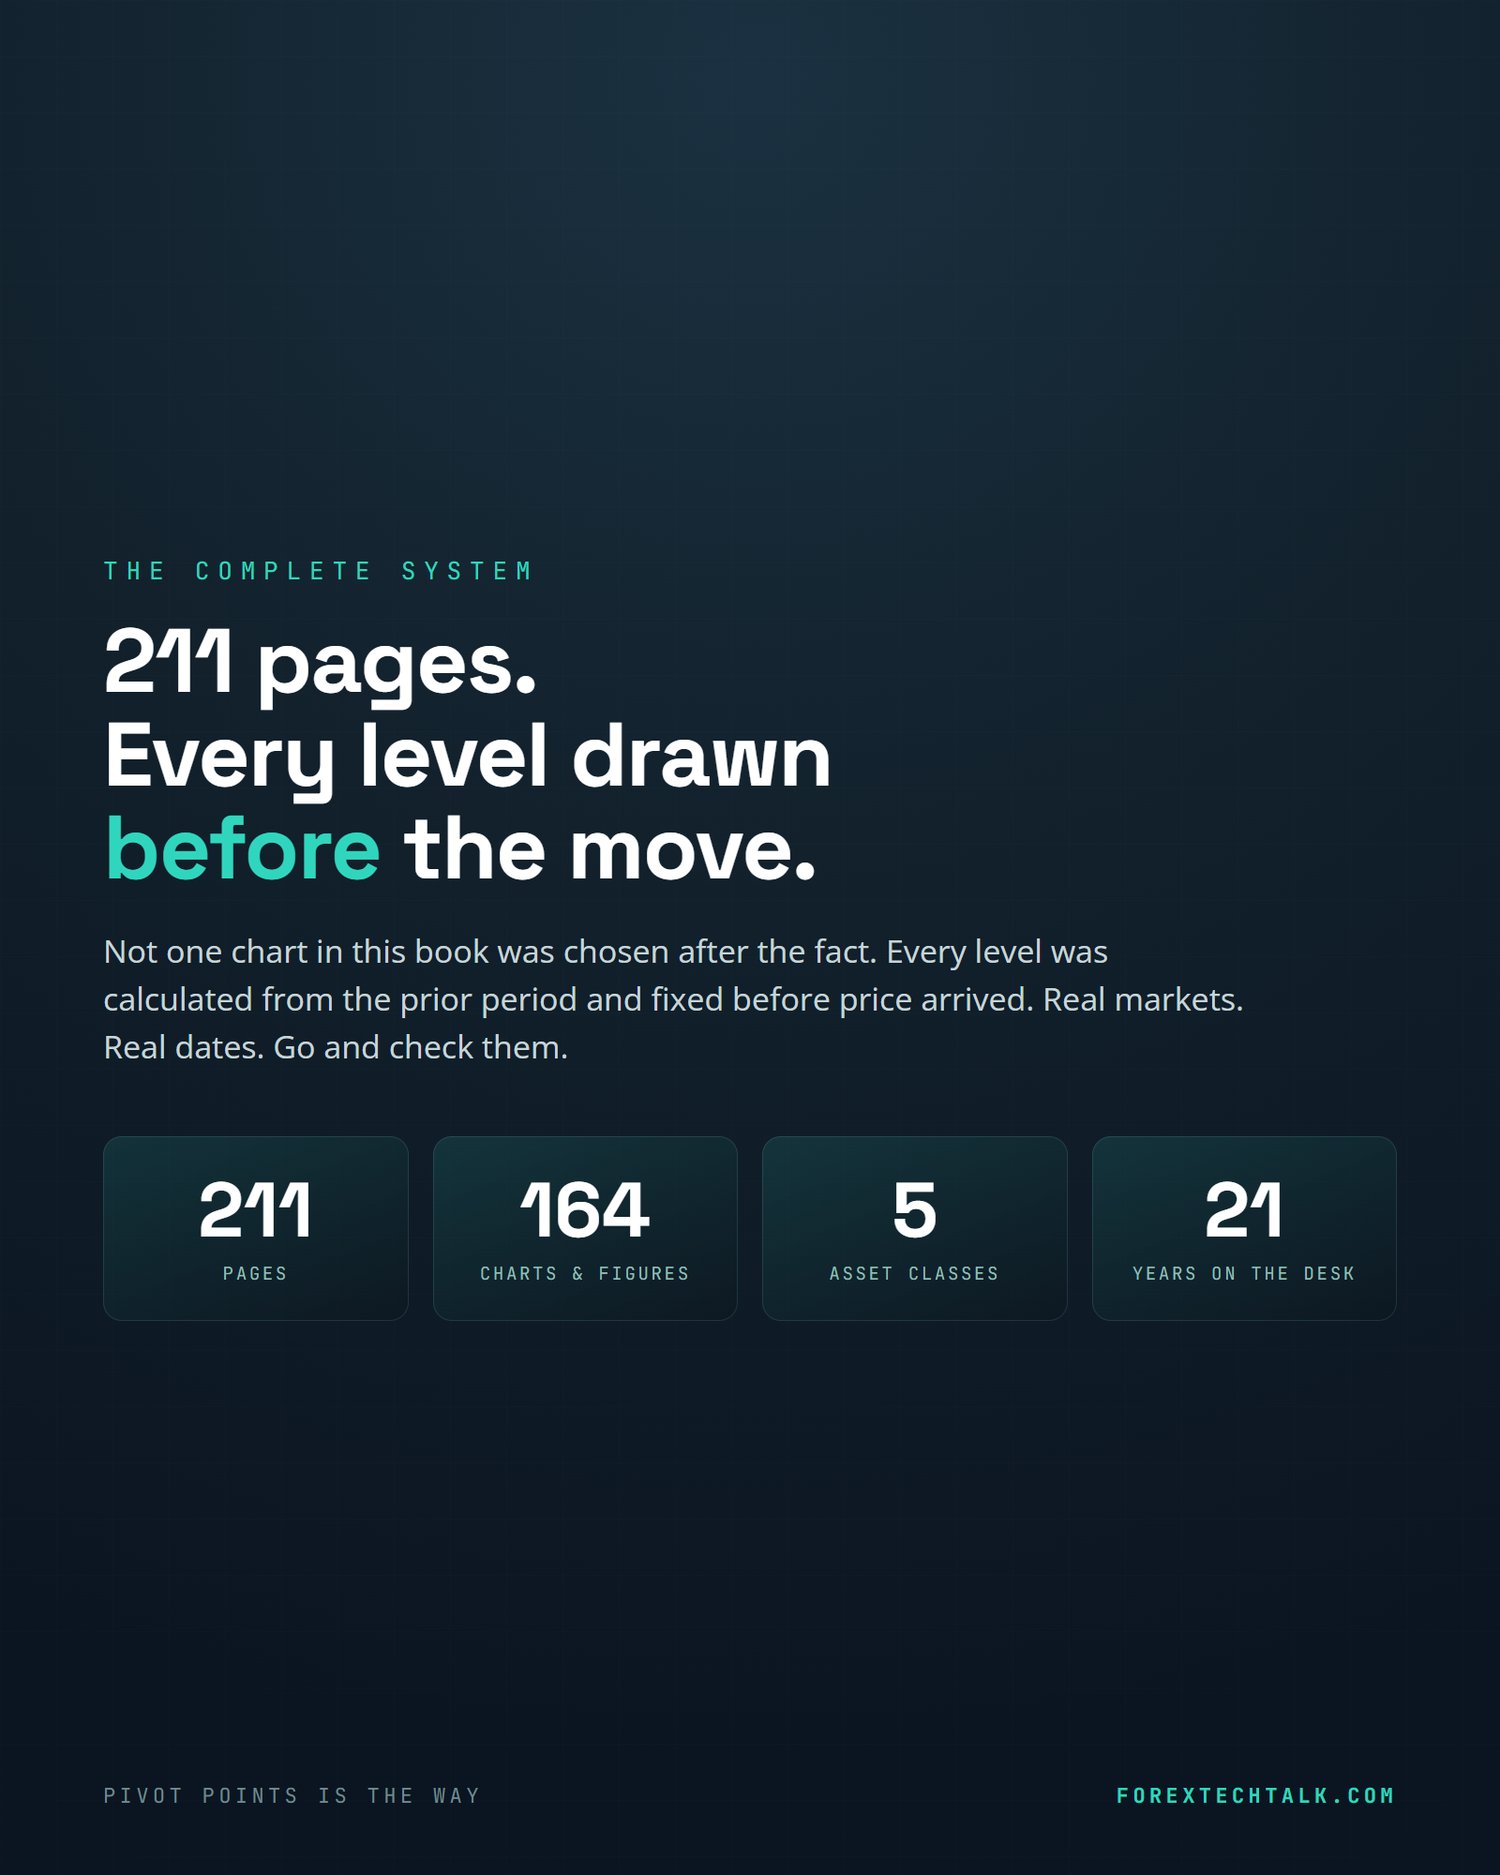
It arrives more often than you would believe. This book spends 211 pages showing you that happening on real markets, on dated charts, across every asset class, so you can go and check every one of them yourself.
Twenty-one years trading. Seventeen on an institutional execution desk.
Leo Grant worked order flow for major American and European funds, graded every single day against one number. He was not reading candles or hunting patterns. He was reading a map of value that most private traders have never been shown. This is that map, taught from the ground up.
What you get:
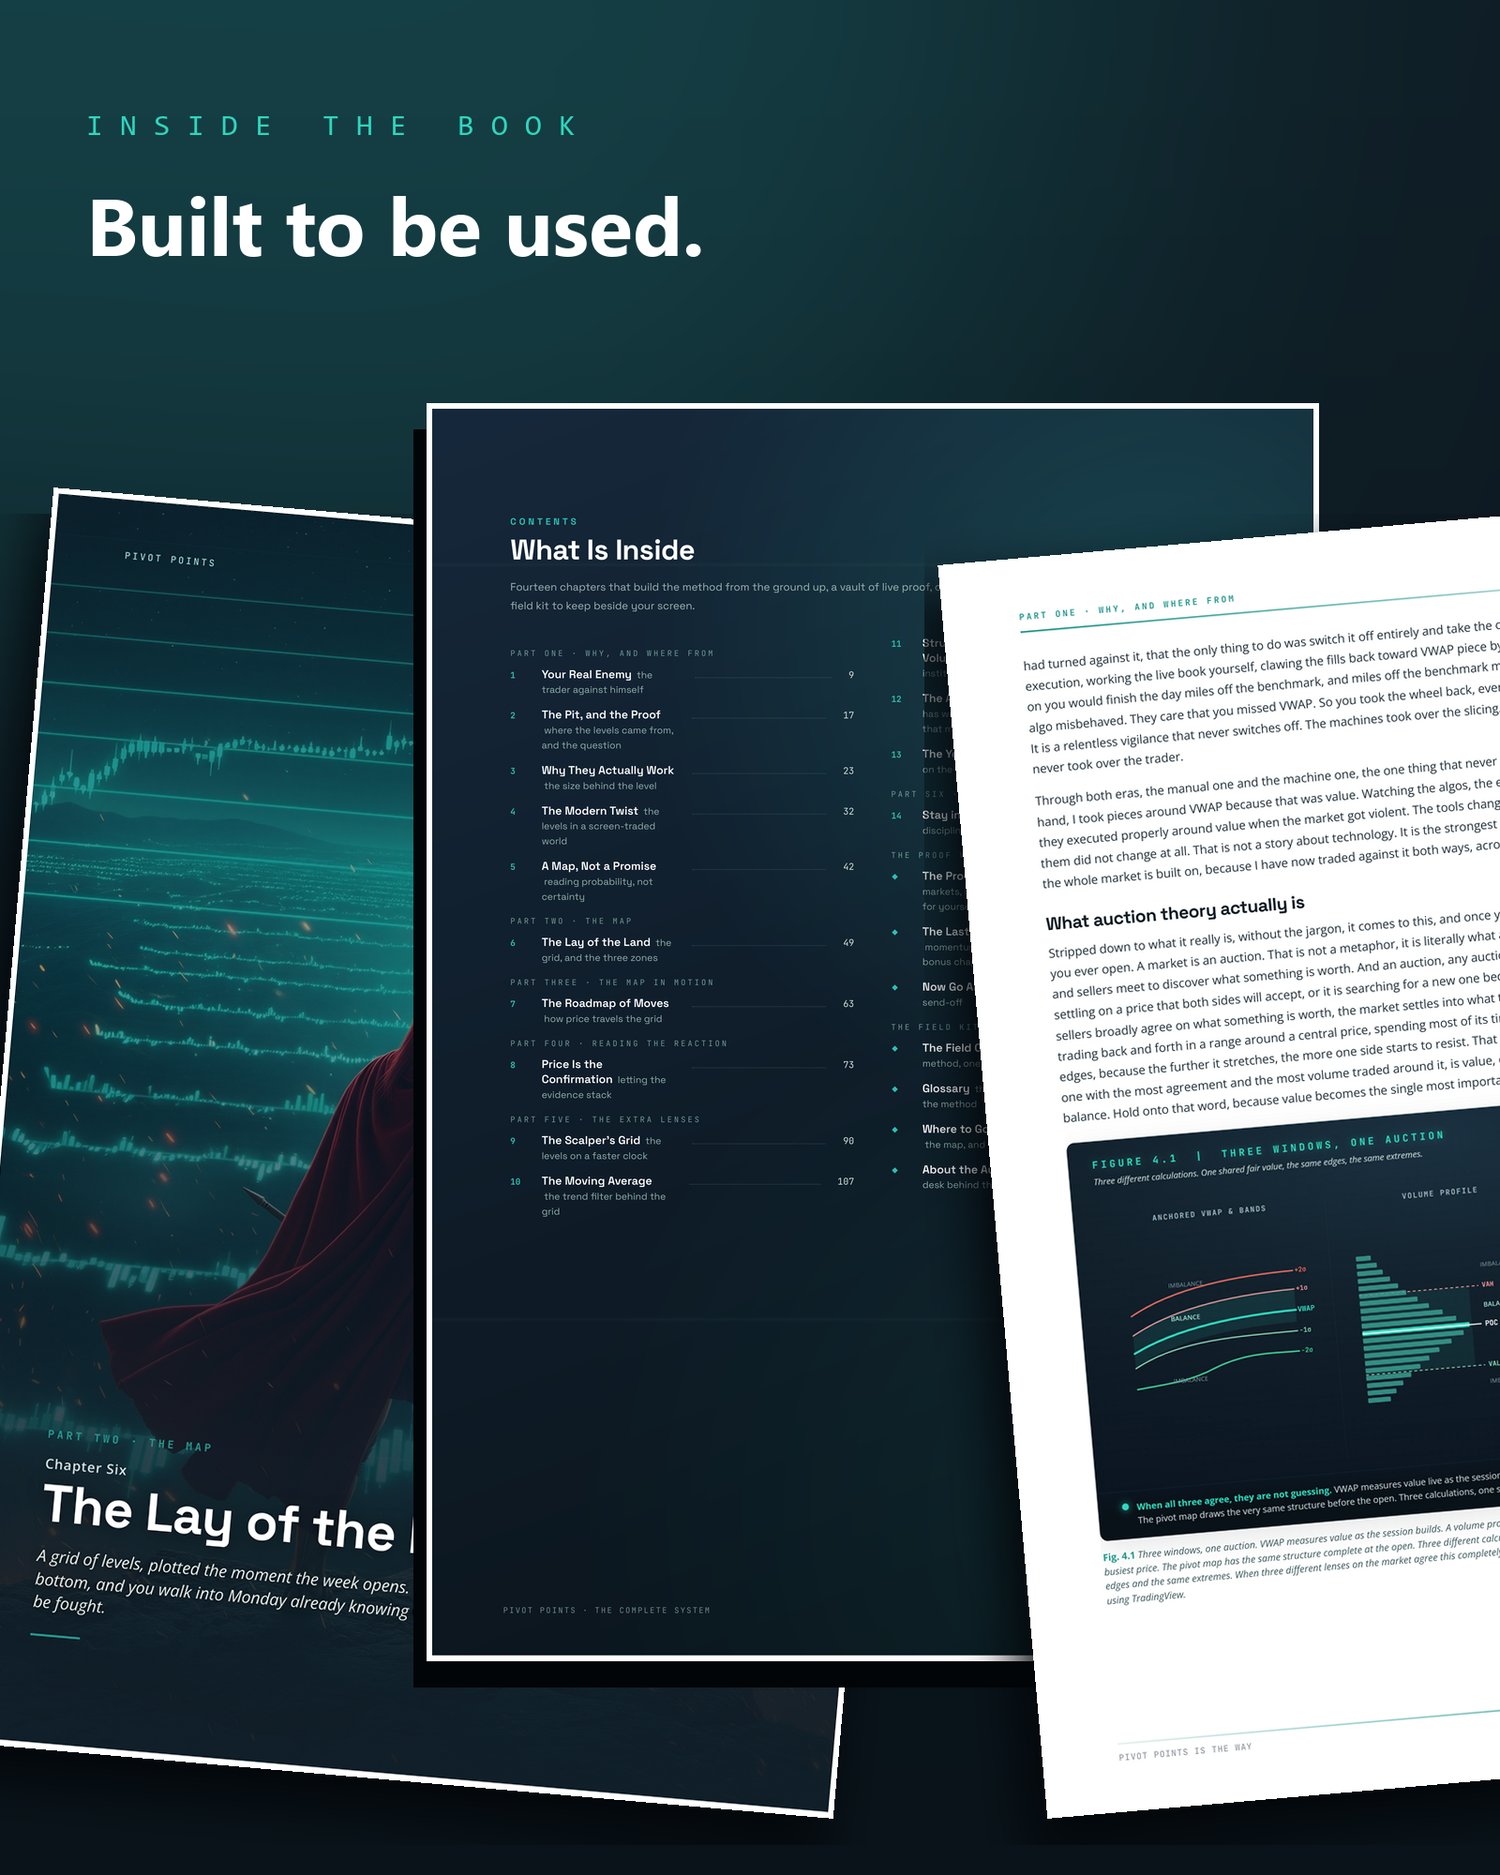
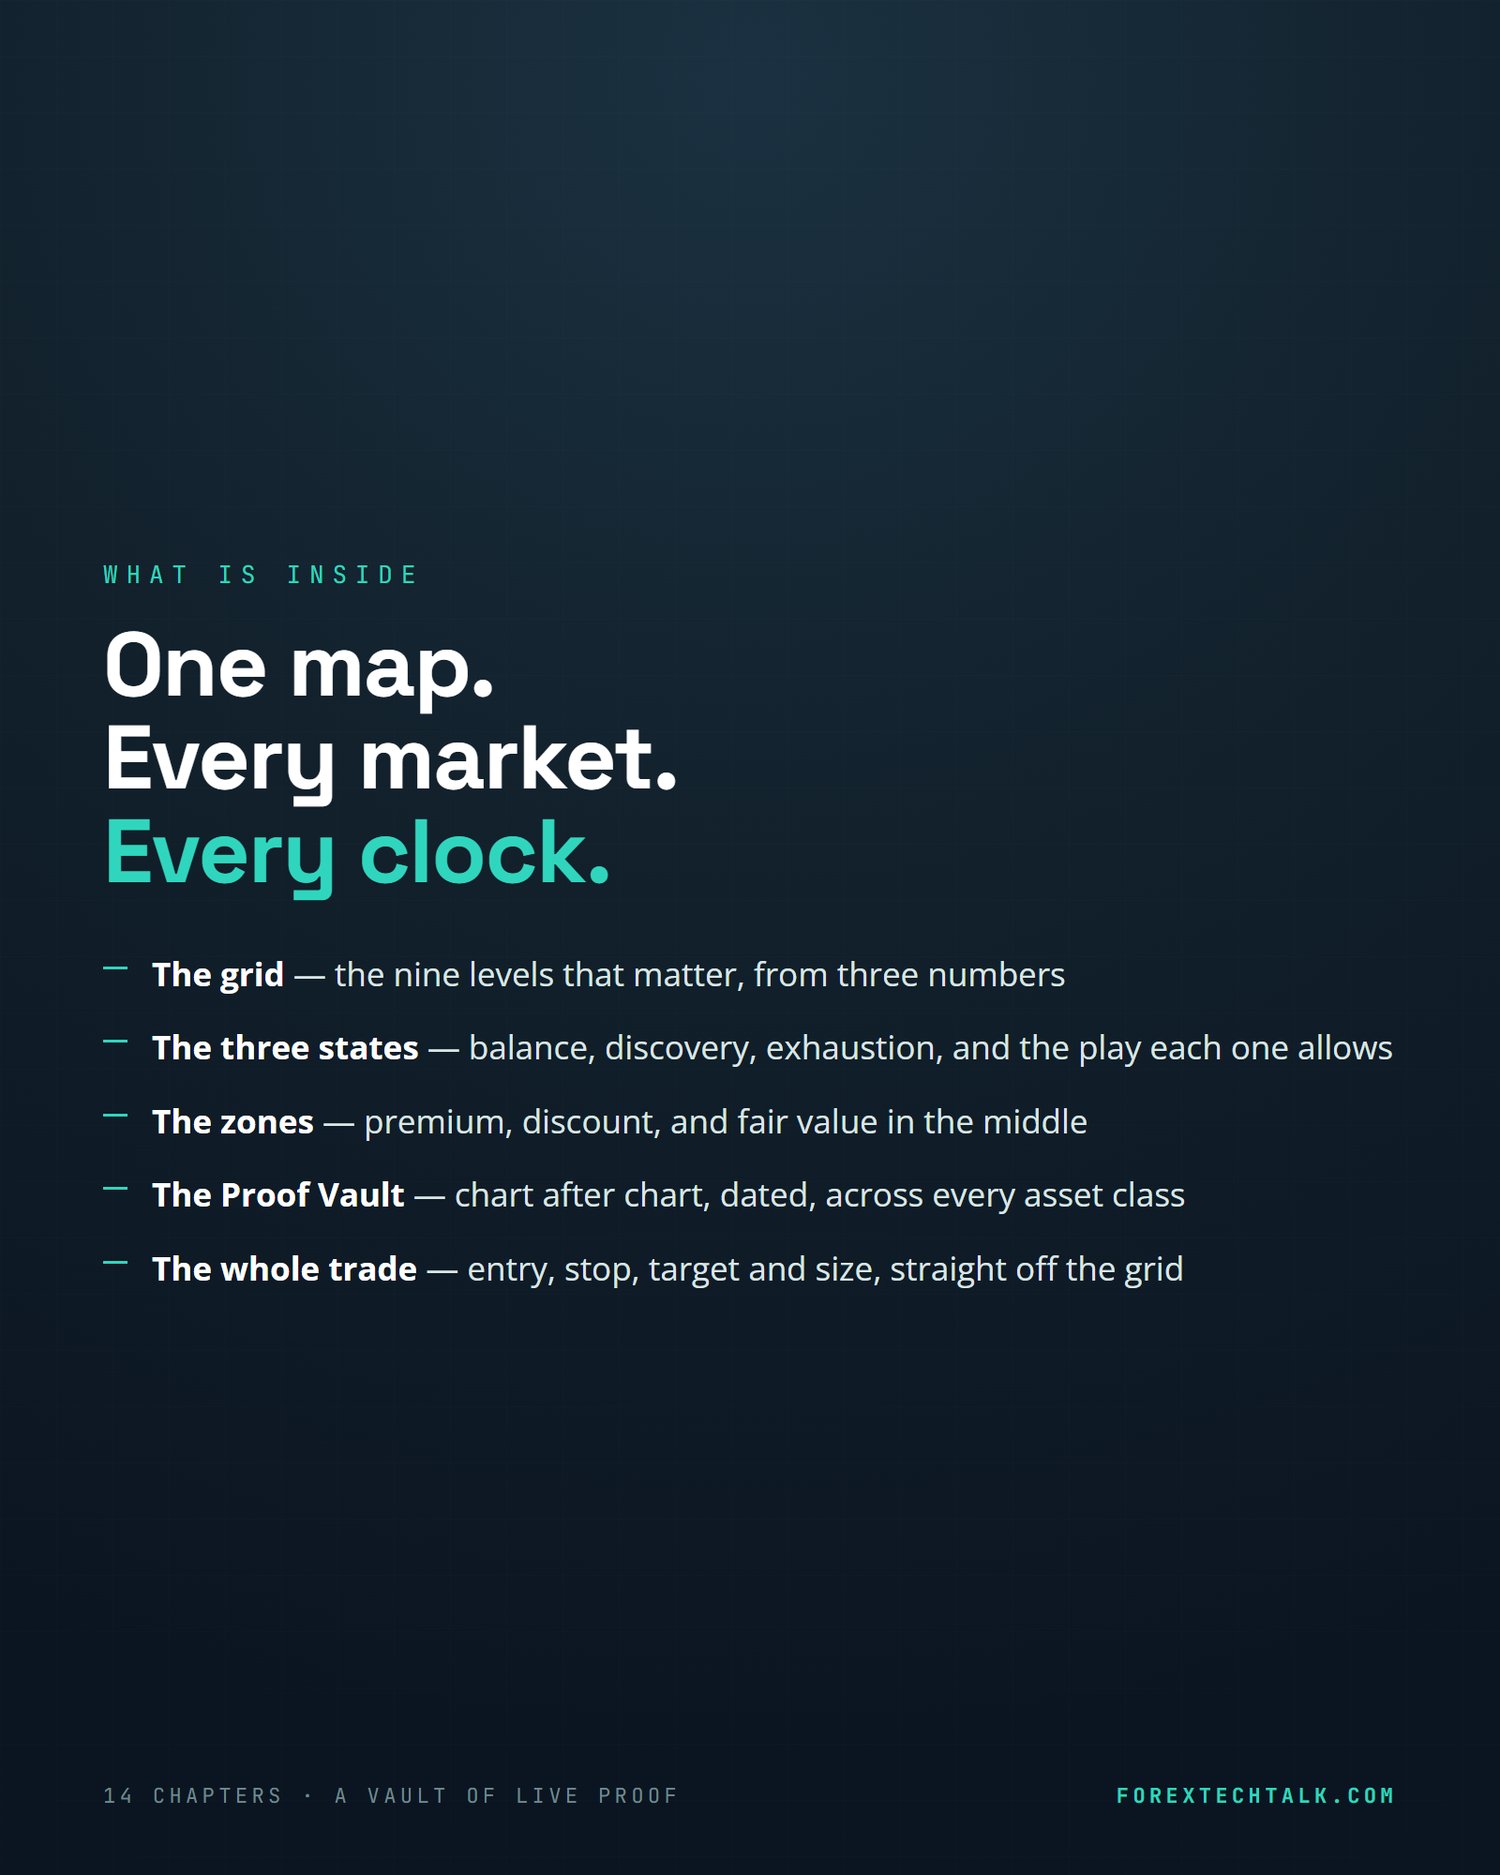
The grid. Nine levels that matter, from three numbers, on any market and any time frame. Not a hundred indicators. One map, and the discipline to read it.
The three states. Balance, discovery, exhaustion. Name the state and you already know which play is on the table and which one will bleed you.
The zones. Premium, discount, and fair value in the middle. Where the patient money steps in, where moves die, and why price keeps coming back to the same line.
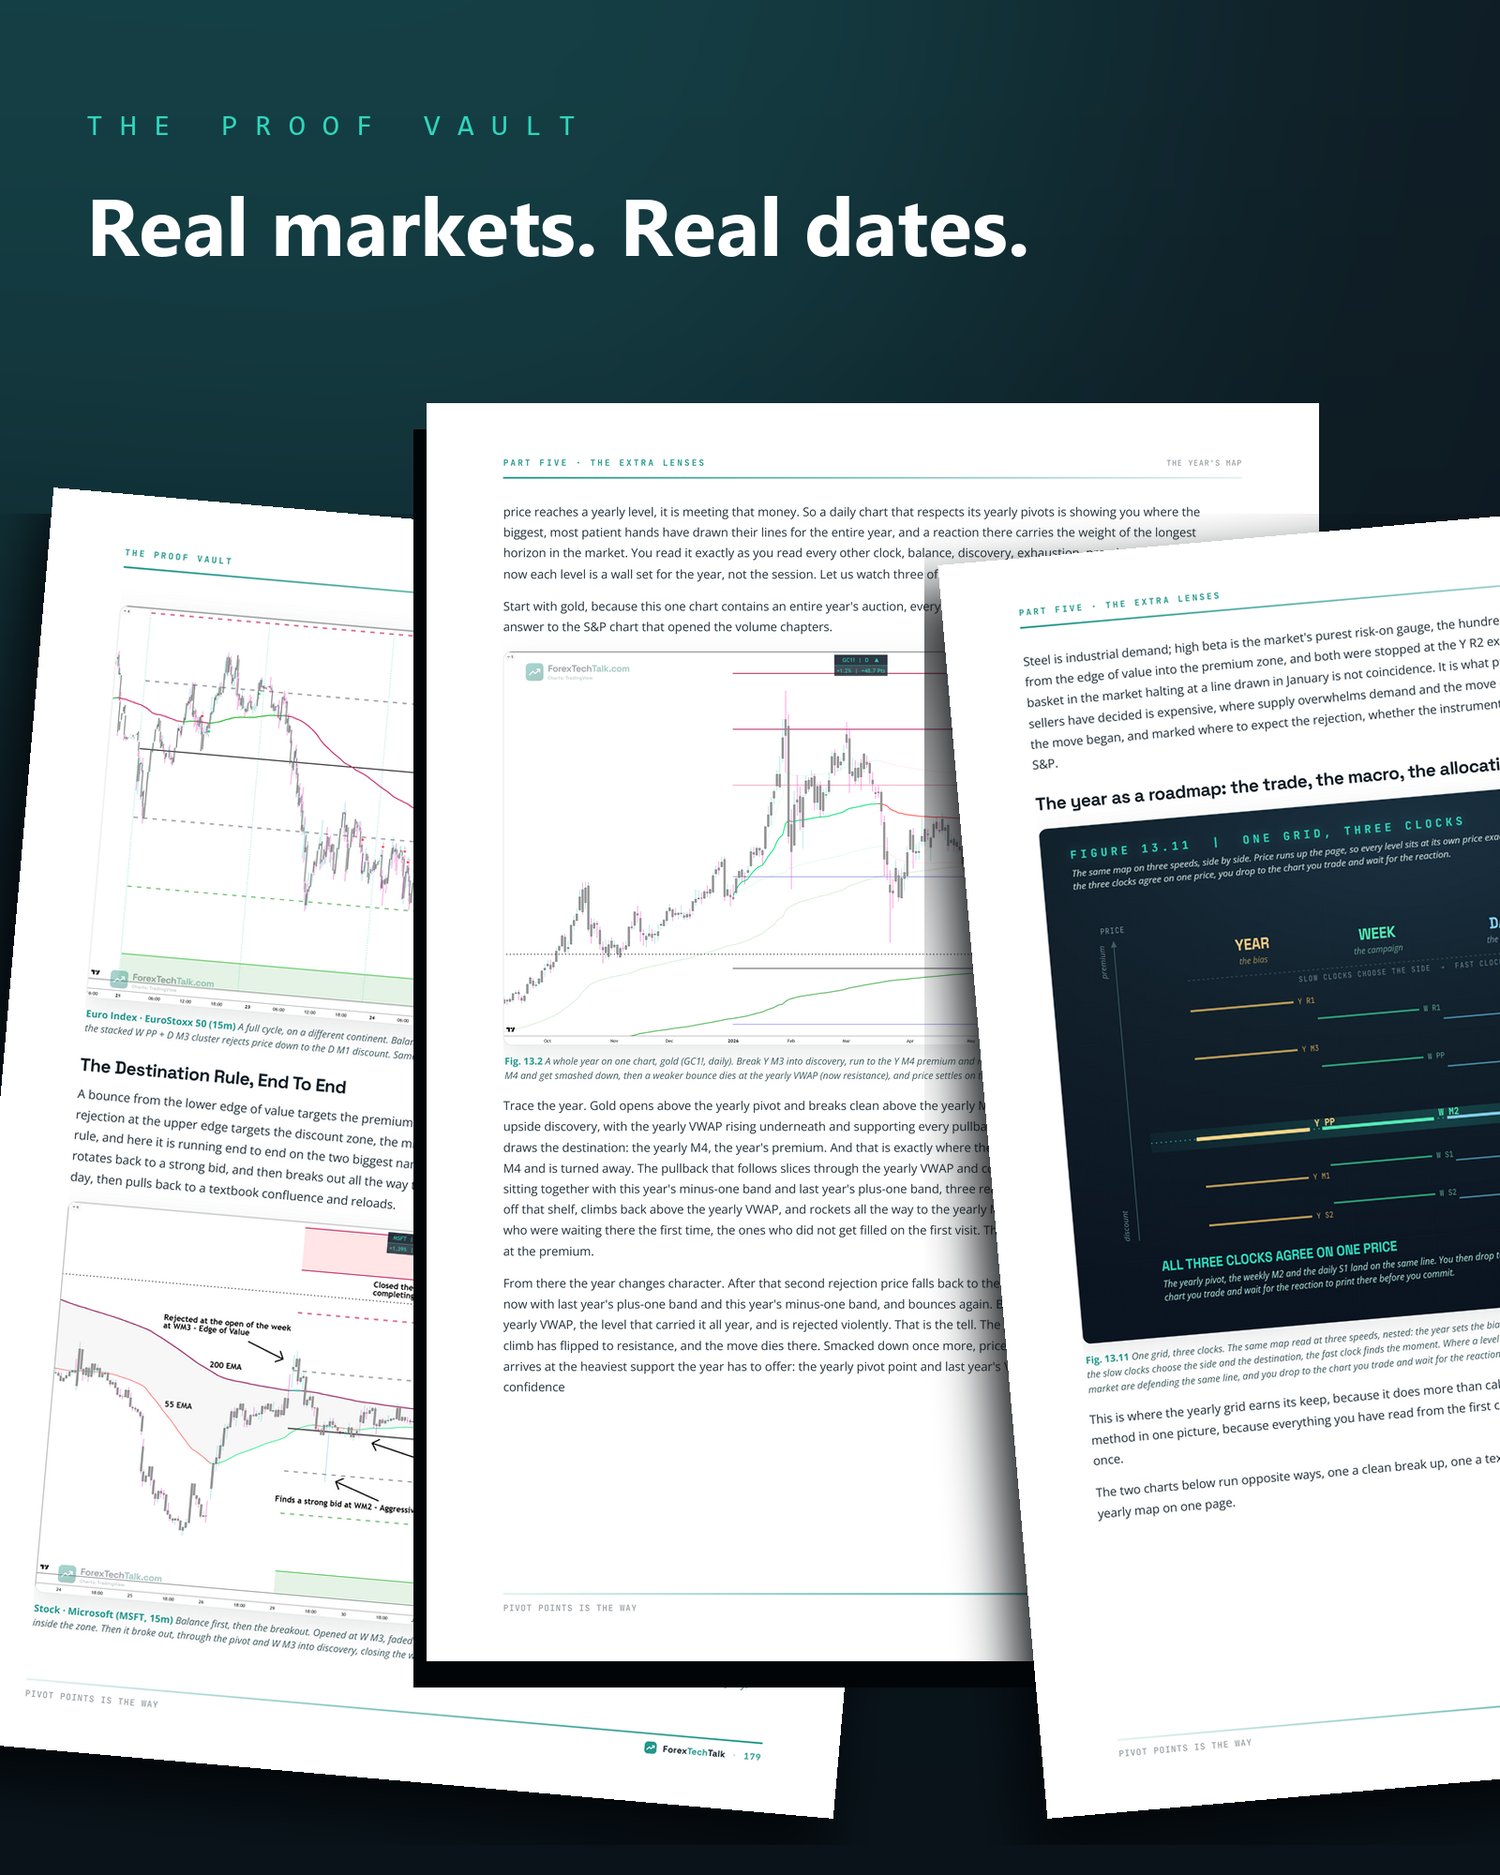
The Proof Vault. Chart after chart, market after market: gold, Bitcoin, the Dollar Index, a blue-chip, a grain, an index future, European equities. Same grid every time. Every level fixed before its move, every turn dated and checkable.
The whole trade. Entry, where the stop actually belongs, the target the grid gives you, and how to size it so a losing run cannot end you.
The Field Card. The one-page summary to keep beside your screen, plus a glossary of the method in plain language.
Plus two indicators, free with the book
You can build the whole grid by hand from three numbers, and the book teaches you to do exactly
that. But you should not have to redo the arithmetic before every session. So every reader gets
both of our TradingView indicators enabled on their own account at no extra cost:
FXTT Pivot Point Legacy. The full grid, drawn automatically on any instrument and any
timeframe. Every level the book teaches you to calculate, plotted the moment the period closes.
FXTT Yearly Pivots Suite. The yearly map from Chapter 12. The slowest clock in the market,
fixed before the year opened, on the chart you actually trade.
Each one comes with a written PDF guide covering every setting, what each level means, and the
mistakes people make with it.
Not a trial. Not a discount code. Yours because you bought the book. After purchase, send us your
TradingView username at forextechtalk.com/marketplace and we enable both, usually within 24 hours.
Visit the website to request access: https://forextechtalk.com/marketplace/
Who this is for:
The trader who has done the courses, bought the indicators, and still cannot answer the only question that matters: which levels actually matter, and what do I do when price gets there?
What this is not:
Not a pattern catalogue. Not signals. Not a system with a "secret" you pay to unlock. There are no income claims in this book because there is no honest way to make one.
The levels were never the secret. Reading them was.
Format: Premium designed PDF · 211 pages · full colour charts and diagrams · instant download
Licence: Single reader, personal use. Each copy is individually stamped to its purchaser.
Educational content only. Not financial, investment, or trading advice. Trading leveraged instruments carries a high risk of loss, up to and beyond your capital, and is not suitable for everyone. Past performance does not guarantee future results.