
Project Gantt Chart — Visual Timeline & Task Tracker in Excel
Plan your project visually. Track progress without complicated software.
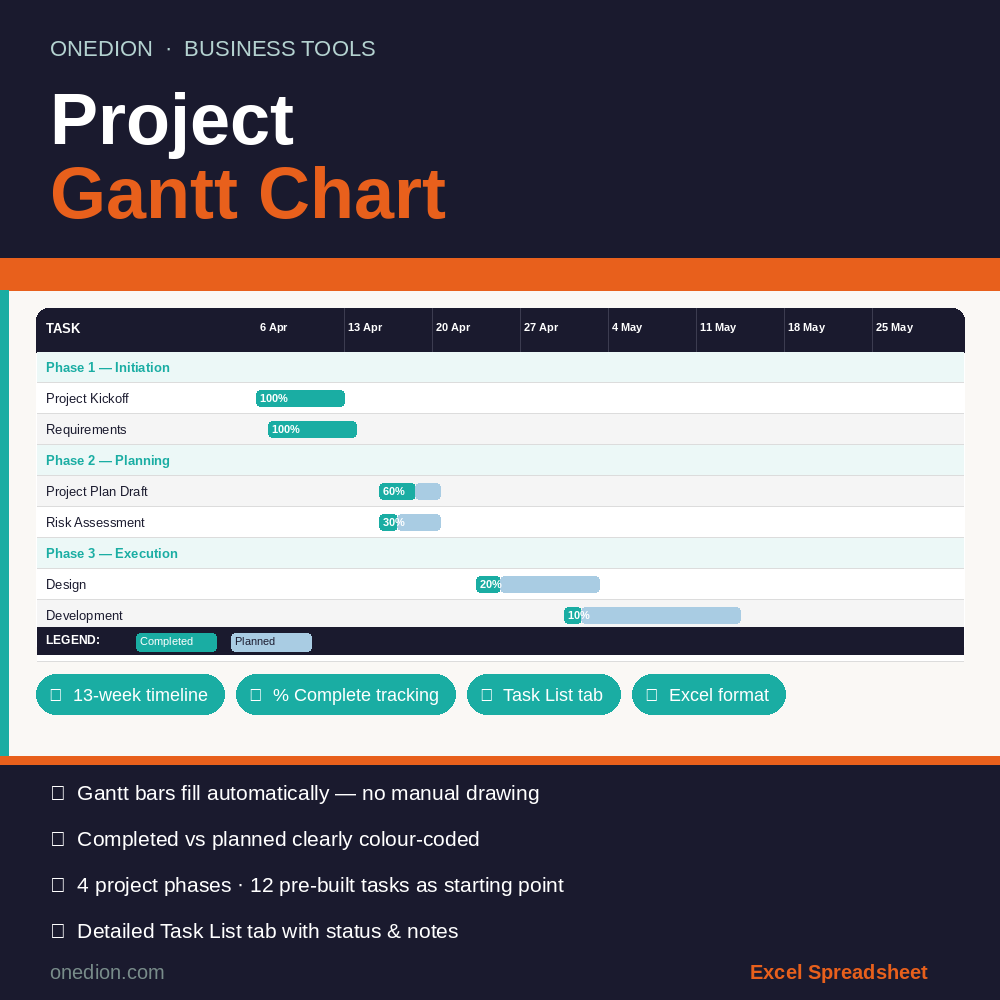
This Excel Gantt Chart gives you a clear visual timeline of every task — colour-coded bars fill automatically based on your dates and progress. No formulas to build, no plugins needed.
WHAT'S INCLUDED
- Gantt Chart tab — 13-week visual timeline, bars fill automatically
- 4 project phases pre-built as a starting point (fully editable)
- % Complete tracking — completed vs planned shown in separate colours
- Task List tab — detailed view with status, notes and summary totals
- End Date calculated automatically from Start Date + Duration
- Instructions tab included
WHY THIS GANTT CHART
Most project managers either overpay for project software or waste hours formatting Excel manually. This template gives you a professional Gantt chart in seconds — just enter your tasks and it builds itself.
Works with Microsoft Excel. (Note: Gantt bars are pre-built — not dynamic conditional formatting, for maximum compatibility.)
Instant download. No subscription. No account needed.