

Hydrofoil Telemetry Chart Plotter
On Sale
$0.00
Pay what you want:
$
An application used for creating and editing custom race courses for Hydrofoil Generation
Hydrofoil Telemetry Chart Plotter User Manual
Introduction
Welcome to the Hydrofoil Telemetry Chart Plotter! This application allows you to upload, visualize, and analyze hydrofoil telemetry data. Use the following guide to get started and make the most of its features.
1. Getting Started
- Accessing the App: Open your web browser and navigate to the Hydrofoil Telemetry Chart Plotter.
- Interface Overview:
- Title Bar: Displays the app name and provides access to settings and information.
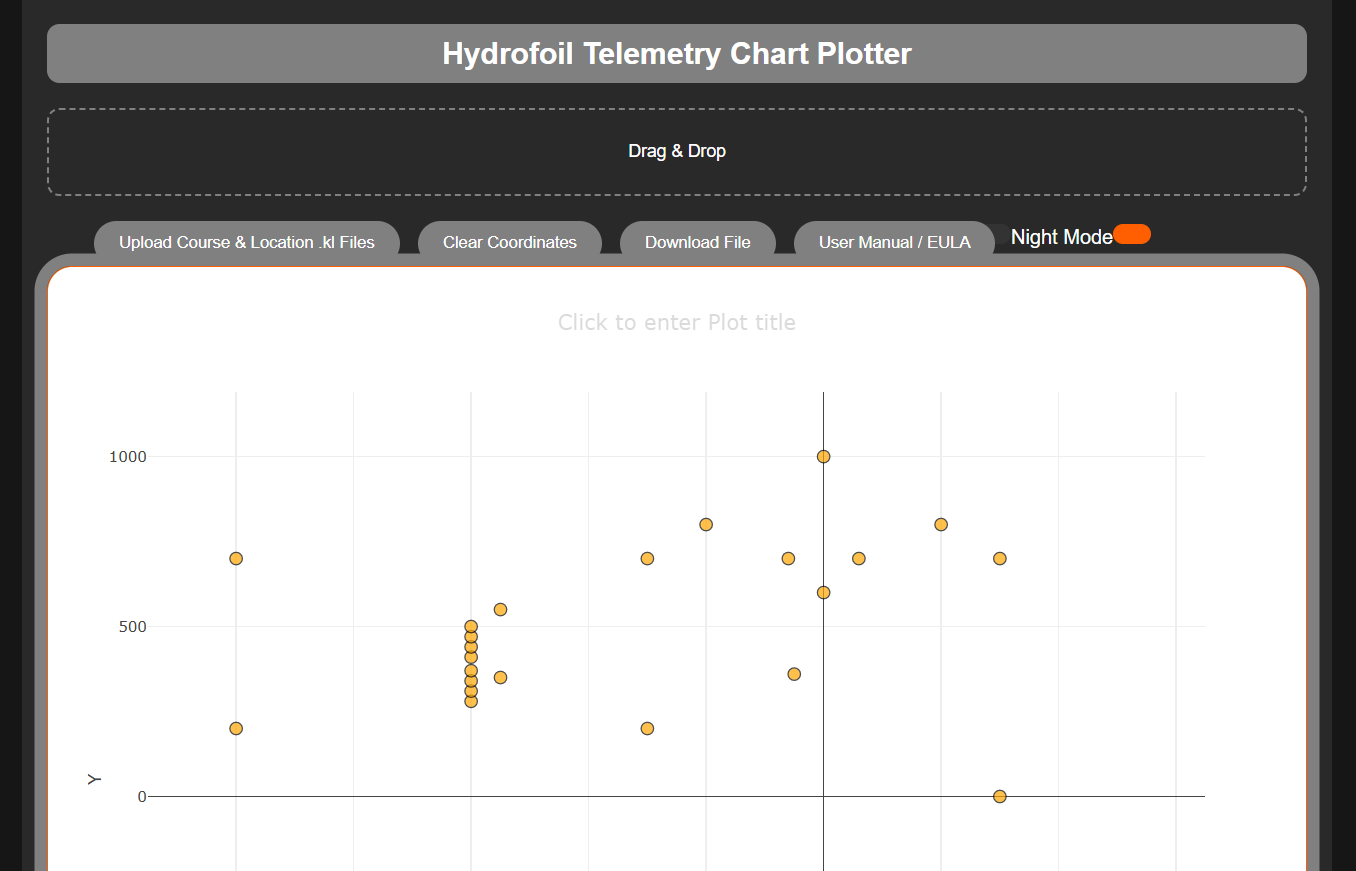
- Upload Container: Area for dragging and dropping files.
- Button Container: Includes buttons for uploading files, clearing data, downloading results, and viewing the user manual.
- Plot Area: Where the telemetry data is visualized.
- Editor Container: Allows you to view and edit raw data.
- Night Mode Toggle: Switch between day and night mode for better visibility.
2. Uploading Data
- Drag and Drop:
- Drag your telemetry data file (e.g., .kl file) into the upload container. The file will automatically be processed, and data will be visualized.
- Using the Upload Button:
- Click on the “Upload Course & Location .kl Files” button to open a file dialog. Select your file to upload it.
3. Visualizing Data
- Plot Area:
- The plot area displays the telemetry data points on a chart. You can interact with the chart to view detailed information about each data point.
- Zoom and Pan:
- Use Plotly’s built-in controls to zoom in/out and pan around the chart.
4. Editing Data
- Text Editor:
- The editor container allows you to manually input and modify telemetry data. The format should follow the pattern pos=x,y.
- Syncing Data:
- Any changes made in the editor will be reflected in the plot. Conversely, changes in the plot will update the editor.
5. Saving and Downloading Data
- Download Button:
- Click on the “Download File” button to save your edited data. You will be prompted to enter a filename for the .kl file.
- File Format:
- Ensure your file ends with .kl for correct format recognition.
6. Clearing Data
- Clear All Button:
- Click the “Clear Coordinates” button to remove all data points from the plot and reset the editor.
7. Viewing the User Manual
- User Manual / EULA Button:
- Click this button to open the user manual and End User License Agreement (EULA) in a new browser tab.
8. Night Mode
- Toggle Night Mode:
- Use the night mode toggle switch to switch between day and night mode for the app interface. This is useful for low-light environments.
9. Troubleshooting
- Common Issues:
- Data Not Displaying: Ensure the file format is correct and data is in the proper format.
- Plot Not Updating: Verify that changes are properly saved and synced between the editor and the plot.
© 2024 - Hydrofoil Telemetry™. All rights reserved.