
Mesa — Restaurant Analytics Dashboard HTML Template
https://mesa-dashboard-demo.netlify.app
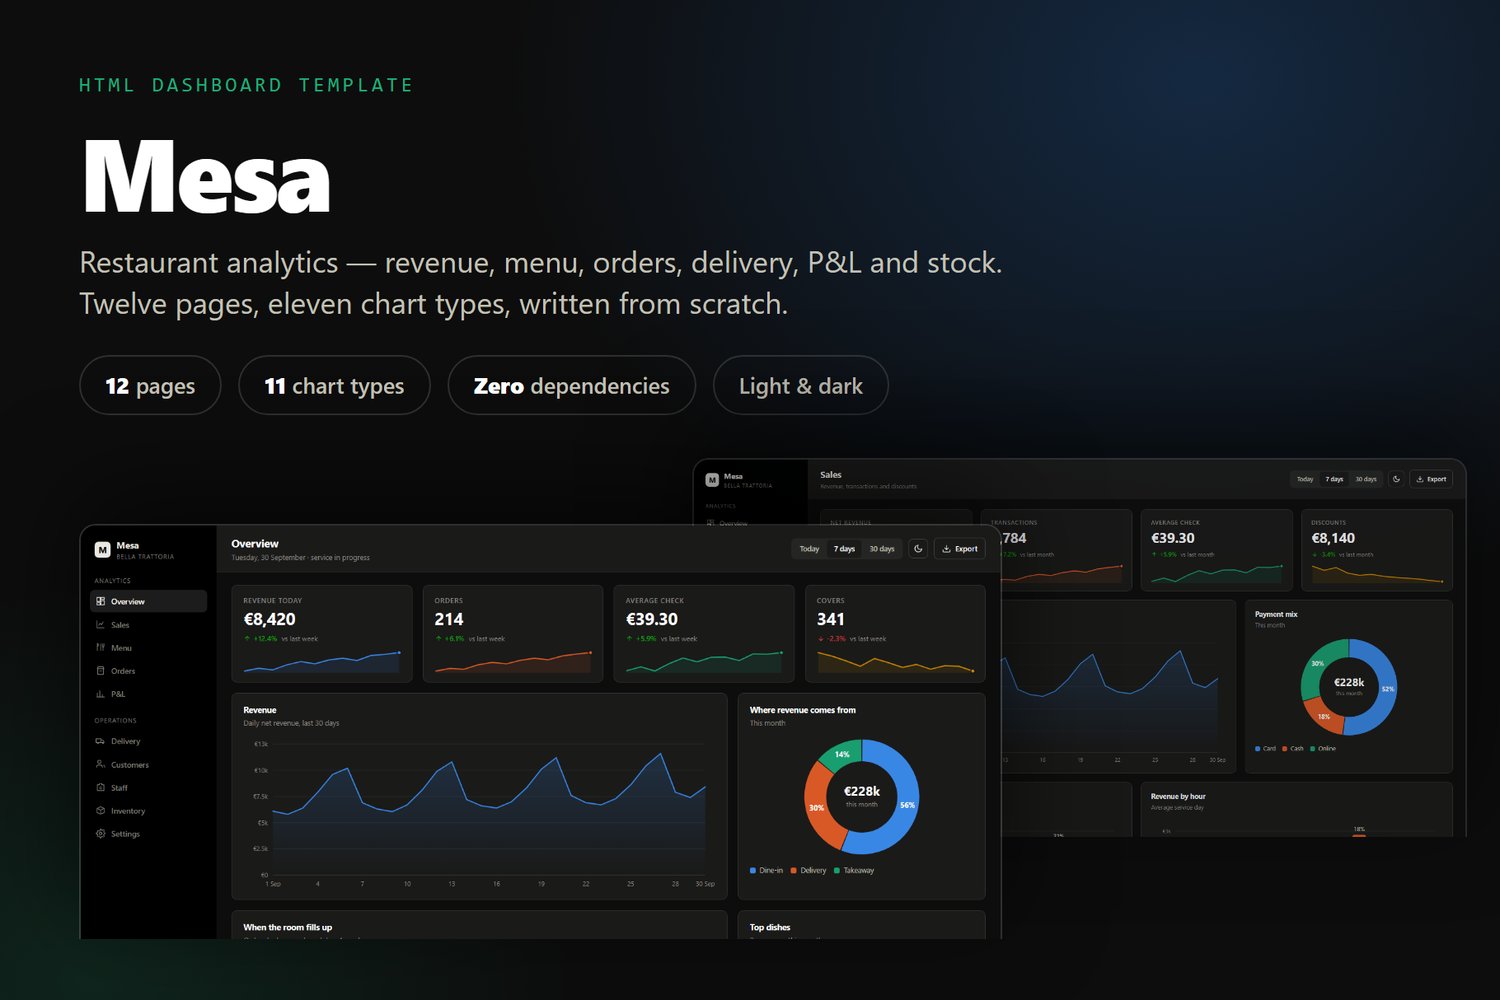
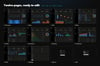
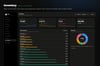
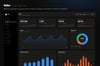
Mesa is a complete analytics dashboard for restaurants, cafés and bars — revenue, menu performance, orders, delivery, profit and loss, and stock, across twelve ready-made pages.
It is built the way a template should be: open index.html and it runs. No npm install, no bundler, no CDN. Everything — including the charts — is plain HTML, CSS and vanilla JavaScript, so the dashboard works offline and on a locked-down intranet.
— WHAT YOU GET —
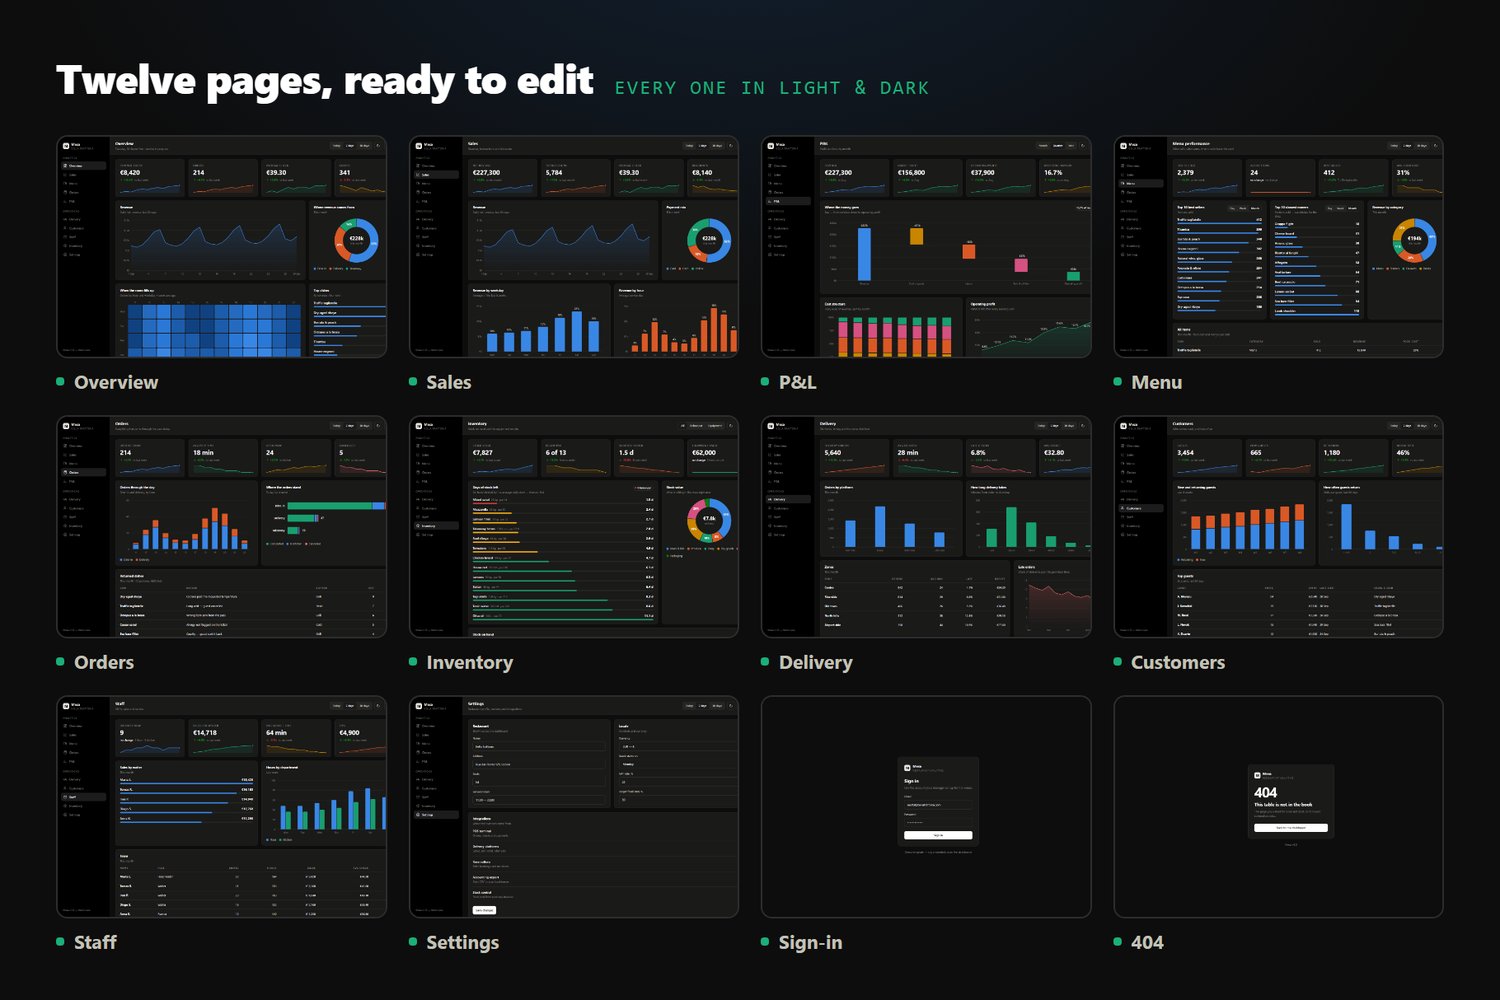
12 HTML pages
• Overview — KPIs, revenue, peak hours, top dishes
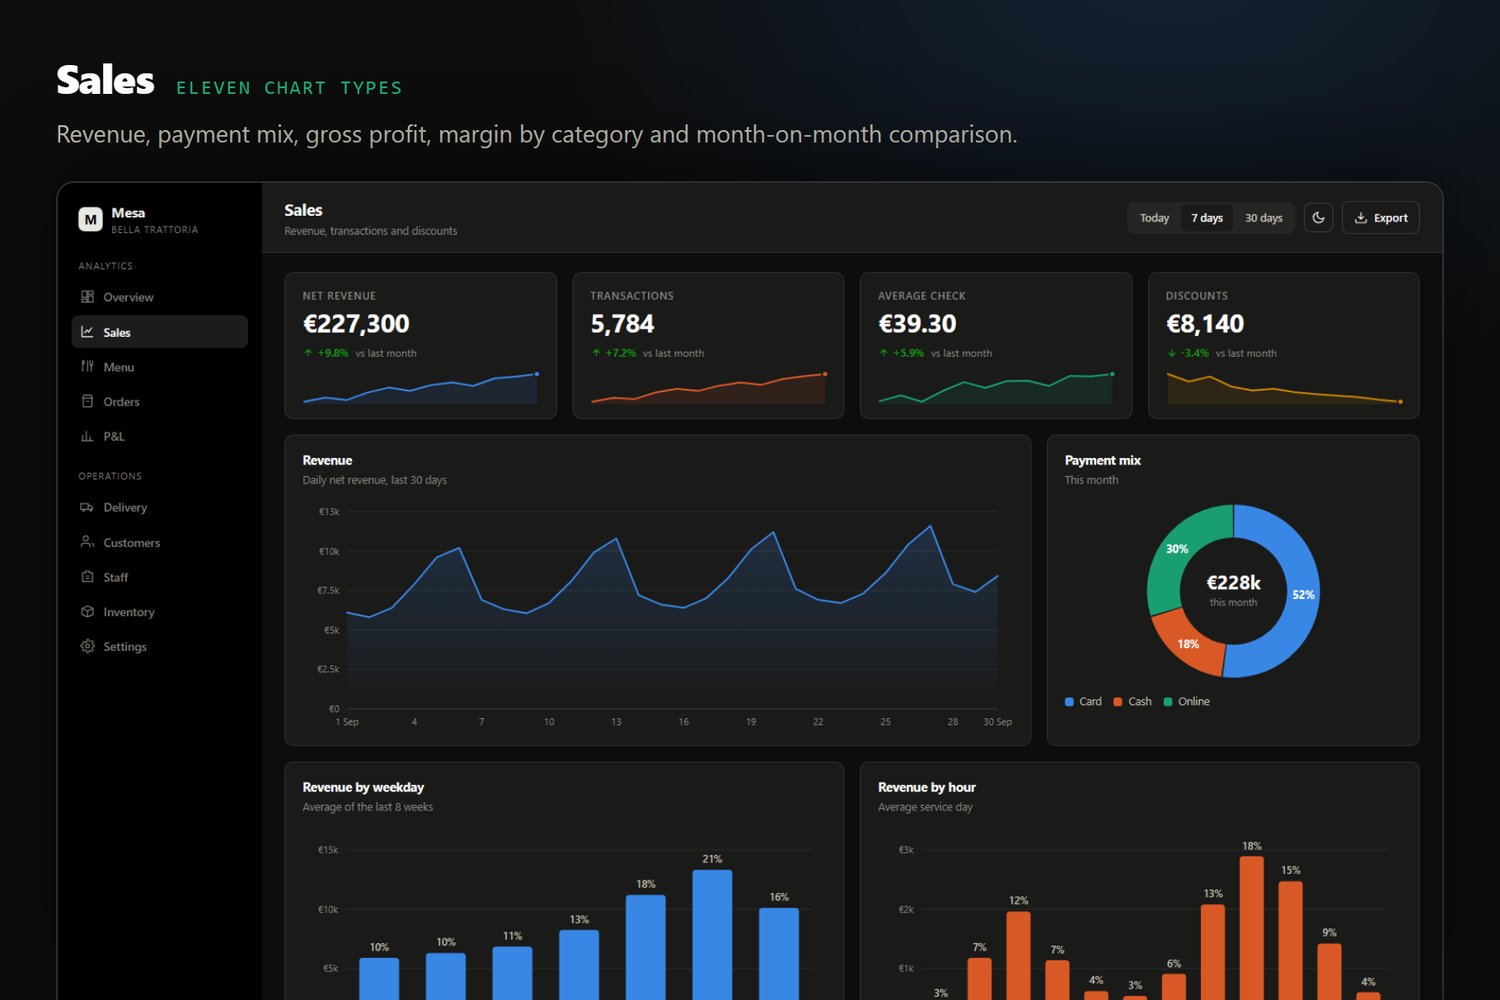
• Sales — revenue, payment mix, gross profit, margin analysis, month-on-month
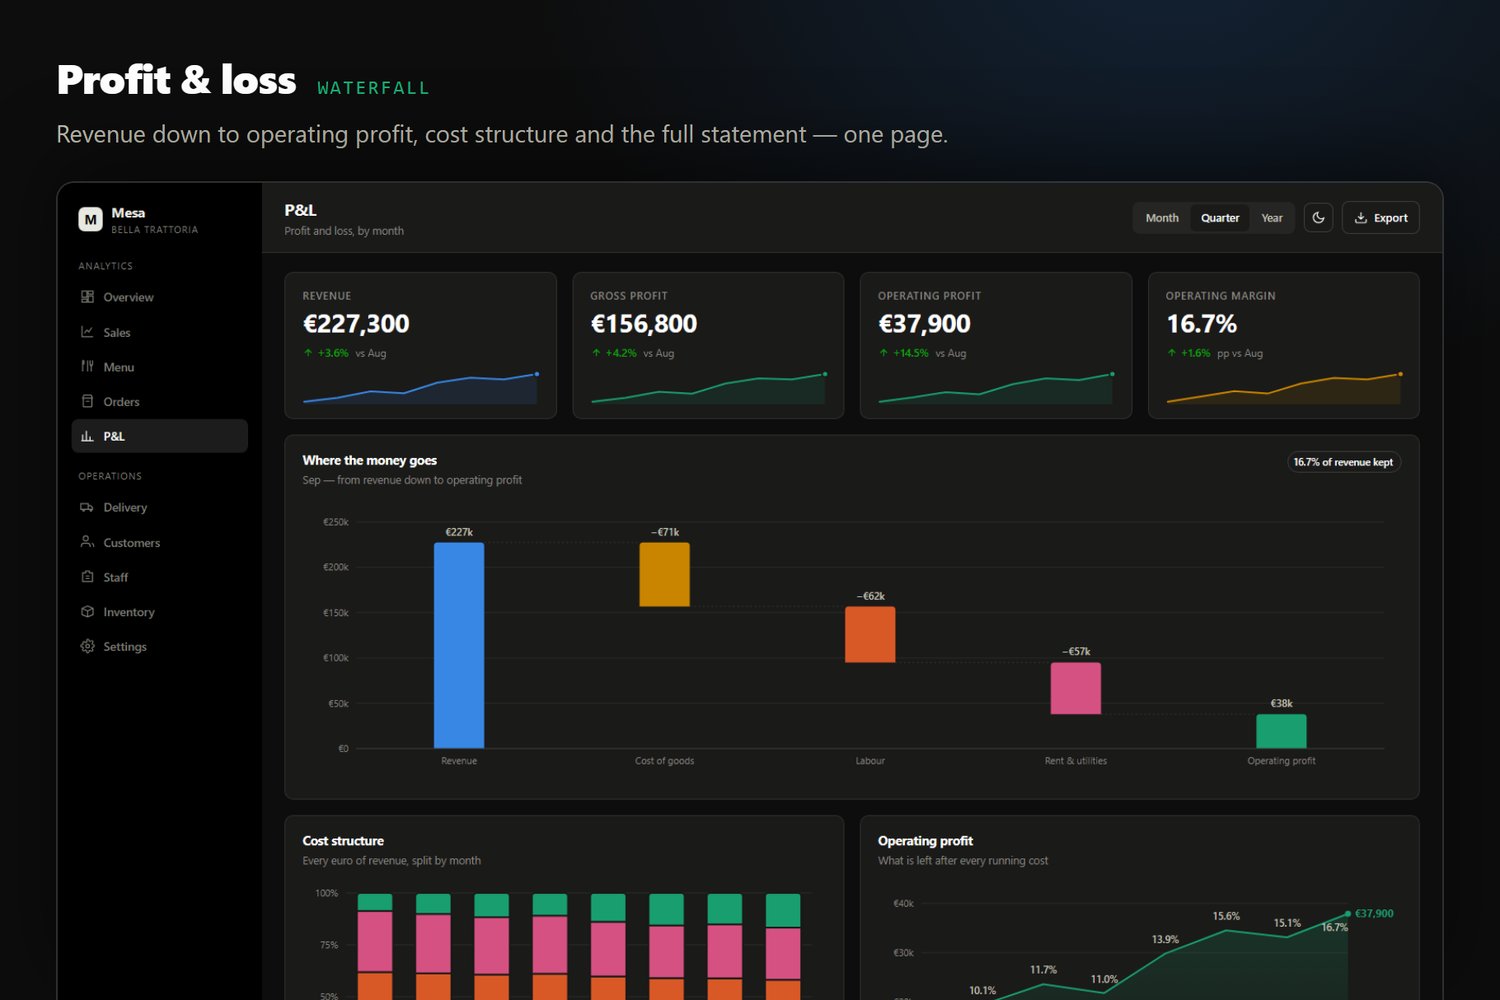
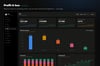
• P&L — waterfall from revenue to operating profit, cost structure, full statement
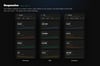
• Menu — best sellers, slowest movers, food cost, menu engineering
• Orders — flow through the day, status by channel, returned dishes
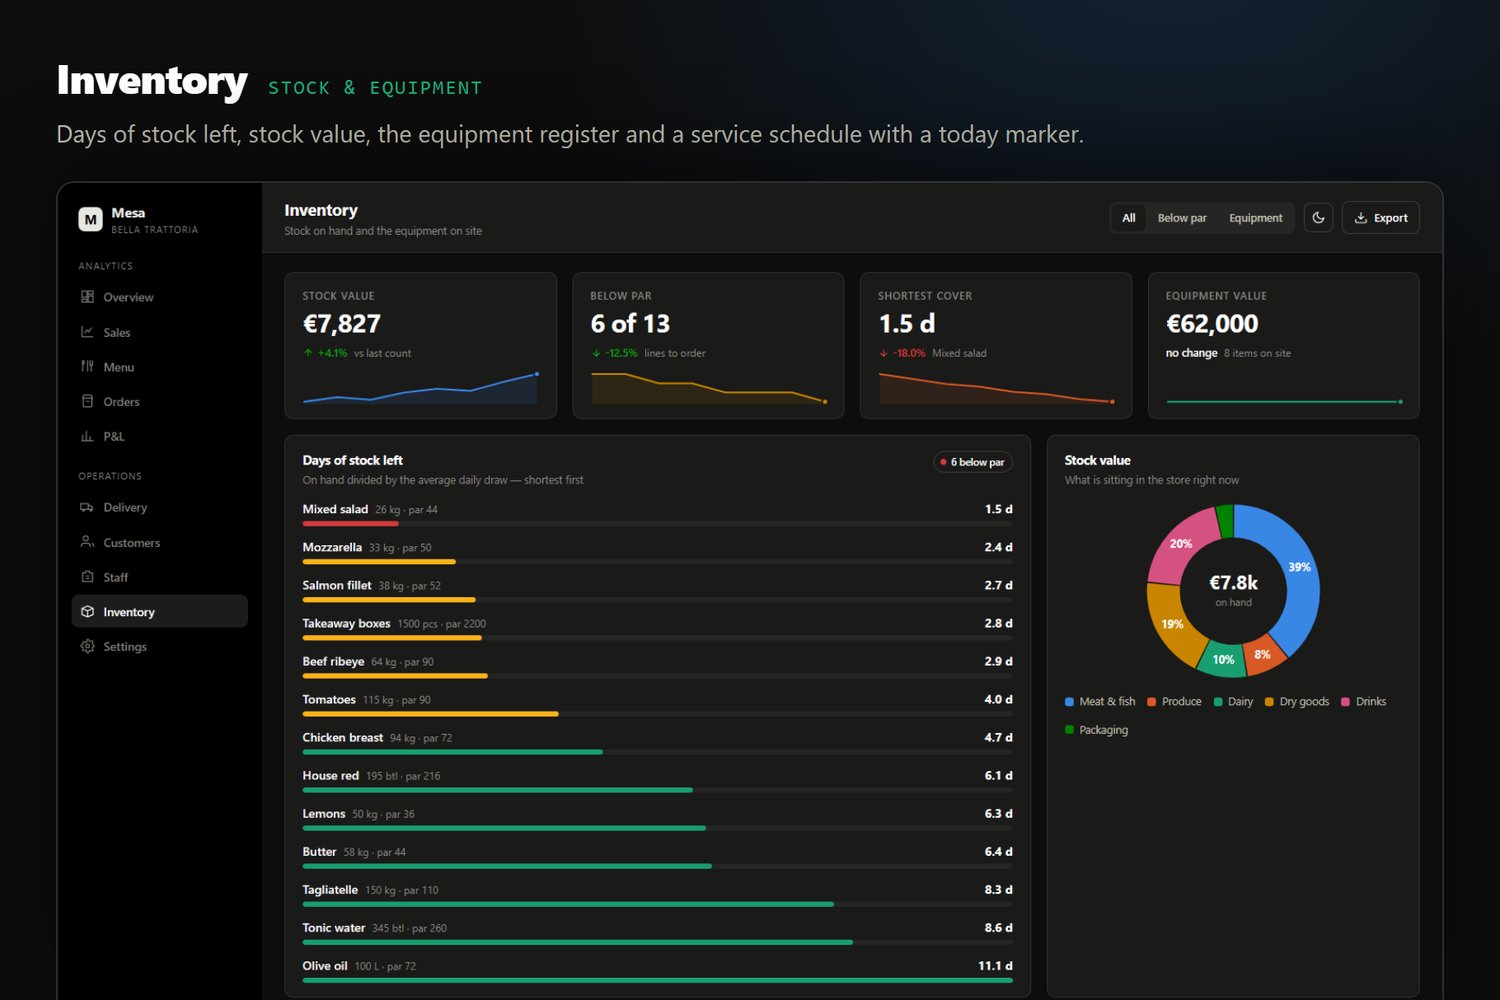
• Inventory — days of stock left, stock value, equipment register, service schedule
• Delivery — platforms, delivery time, late orders, zones
• Customers — new vs returning, visit frequency, top guests
• Staff — waiter performance, hours, service table
• Settings, Sign-in, 404
11 chart types, hand-written in SVG
Line and area · vertical bars, grouped and stacked · horizontal stacked bars · P&L waterfall · service timeline with a "today" marker · donut with share labels · sparklines · scatter · ranked bar list · trend rows · weekday x hour heatmap. Every chart has a hover tooltip.
— WHY IT IS DIFFERENT —
Zero dependencies. No Chart.js, no jQuery, no Bootstrap, no Tailwind, no Google Fonts. Nothing to update, nothing to break, nothing that phones home. The whole template is one stylesheet and three small scripts.
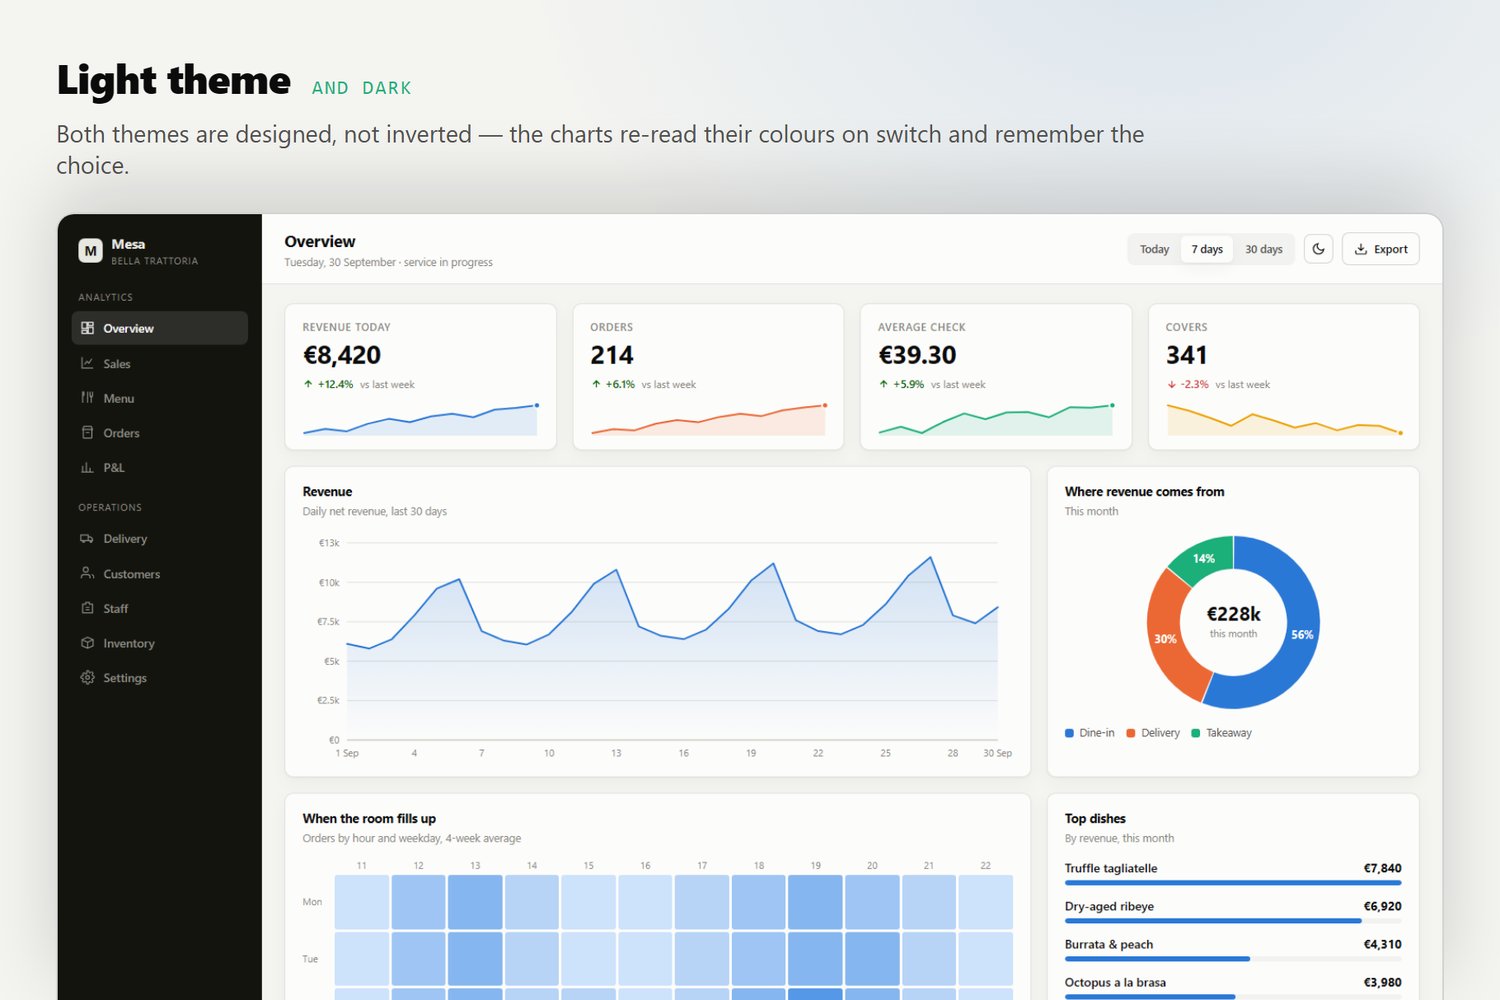
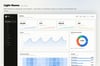
Dark by default, light included. The pages ship dark with no flash of white; the toggle switches to light and remembers the choice. Charts re-read their colours on switch, so both themes are correct — not an automatic inversion.
Colour-blind safe palette. The categorical colours are validated so that every adjacent pair stays distinguishable under deuteranopia, protanopia and tritanopia. Sequential scales are single-hue; status colours are separate and always ship with a label, never colour alone.
Export built in. The Export button turns the page into a CSV and downloads it — tables as rendered, or the KPI tiles on pages without one. Again: no library.
Your data in one file. Every number lives in js/data.js inside a single DATA object. Replace the values, keep the shape, and all twelve pages update. Nothing is hard-coded in the markup.
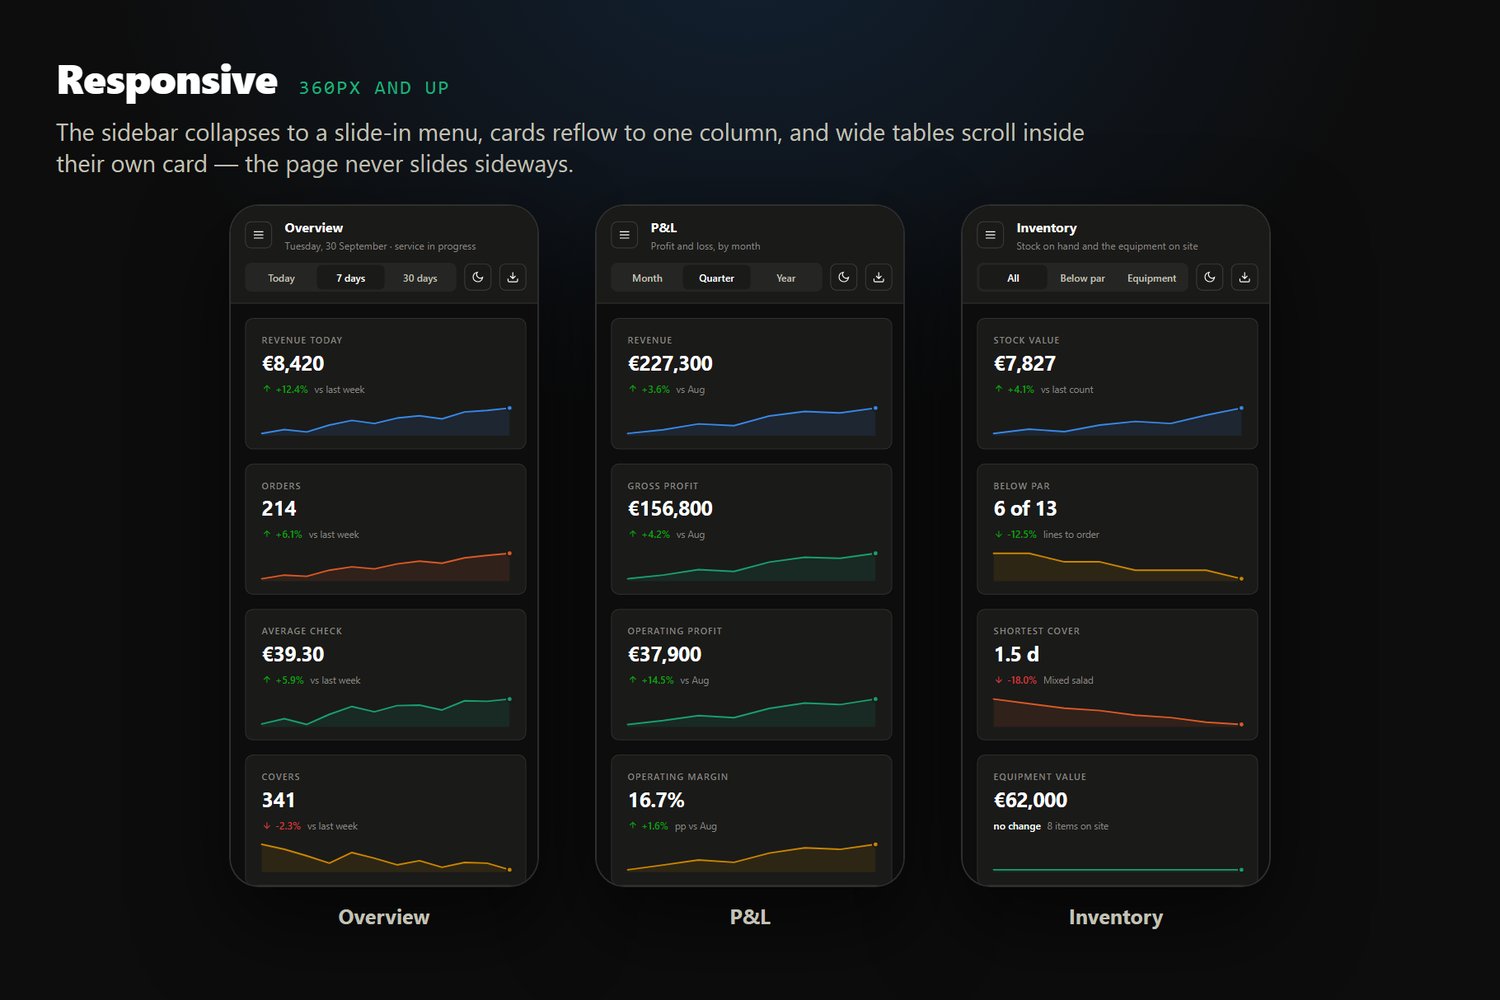
Responsive. From 360px phones to wide monitors. The sidebar collapses to a slide-in menu, cards reflow, wide tables scroll inside their own card so the page never slides sideways.
Clean, commented code that reads well in a handover or a code review.
— INCLUDED IN THE DOWNLOAD —
• 12 HTML pages
• css/style.css — all styles, design tokens at the top
• js/charts.js — the chart engine
• js/data.js — all demo data
• js/main.js — theme, navigation, tables, export
• README.md — setup, customising, the full chart API
• LICENSE.txt
— GOOD TO KNOW —
The figures shipped with the template are realistic demo data for a fictional restaurant; no real business numbers are included. The date-range buttons in the top bar and the sign-in form are deliberate placeholders — point them at your own backend and the rest of the page already works. Everything else is live.
Browser support: latest Chrome, Edge, Firefox and Safari, desktop and mobile.
— WANT IT FILLED WITH YOUR OWN NUMBERS? —
All the figures sit in one file, so swapping them is straightforward. If you would rather not do that part yourself, I can set it up for you — a one-off load of your own data, a converter from your POS or spreadsheet exports, or a live connection to a system that offers an API. It is a paid service, quoted per job. Message me through the store and tell me what you are running.
Live demo: https://mesa-dashboard-demo.netlify.app