

Automated US Retail ABC Analysis Dashboard & VBA Engine
Stop wasting hours manually sorting inventory, writing complex formulas, and building charts from scratch!
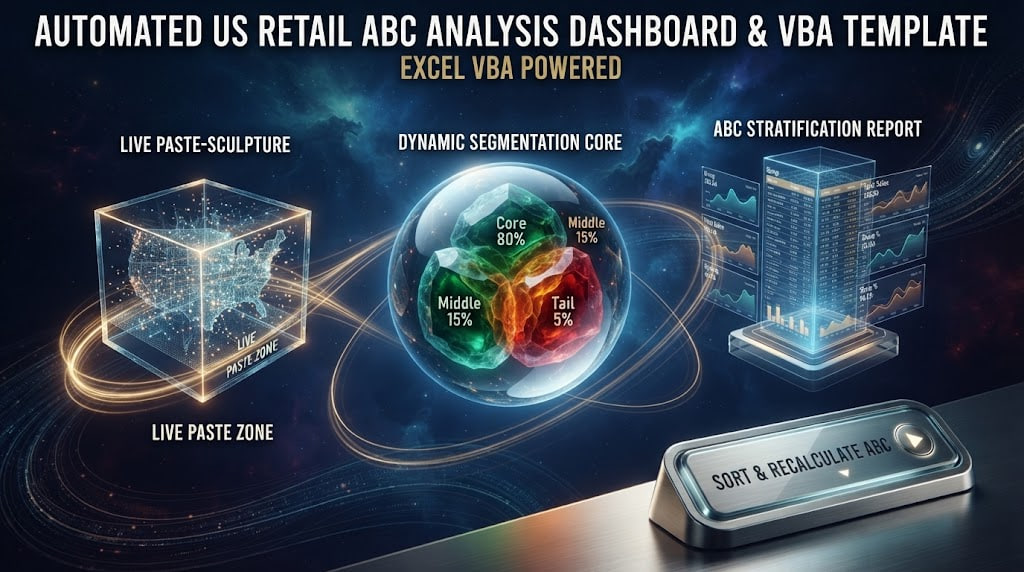
This production-ready, interactive Excel template is built specifically for US retail analysts, supply chain specialists, and finance professionals. It features a clean 2-sheet architecture designed for a seamless "paste-and-click" workflow.
🔥 HOW IT WORKS (THE 2-SHEET ARCHITECTURE):
1. Sheet 1 ("01_Raw_Data_Source"): A clean, pre-loaded master dataset with 150+ realistic US retail transactions (Transaction IDs, Dates, States, Category Groups, SKUs, and Gross Sales in $US). Perfect for testing and practicing.
2. Sheet 2 ("02_ABC_Dashboard"): Your interactive command center equipped with a dedicated Paste Zone and a built-in "Sort & Recalculate ABC" button.
⚙️ WHAT THE ONE-CLICK AUTOMATION DOES:
- Aggregates raw data by product category groups automatically.
- Sorts categories instantly in descending order (Largest to Smallest sales).
- Calculates individual revenue shares and cumulative percentages.
- Applies professional US supply chain ABC thresholds: Tier A (Core up to 80%), Tier B (Middle up to 95%), and Tier C (Tail).
- Dynamically updates and redraws a live executive Pie Chart showing sales share by group.
📦 WHAT YOU GET:
- 1x Ready-to-use Excel Macro-Enabled Workbook (.xlsm) featuring the 2-sheet layout and live button control.
- Clean, error-free embedded VBA engine with built-in dictionary aggregation and auto-charting logic.
Perfect for corporate reporting automation, portfolio projects, or following along step-by-step with our YouTube masterclass tutorial!