
IGCSE Extended Booklet 12 - Graphs in Practical Situations | Original 22-page PDF
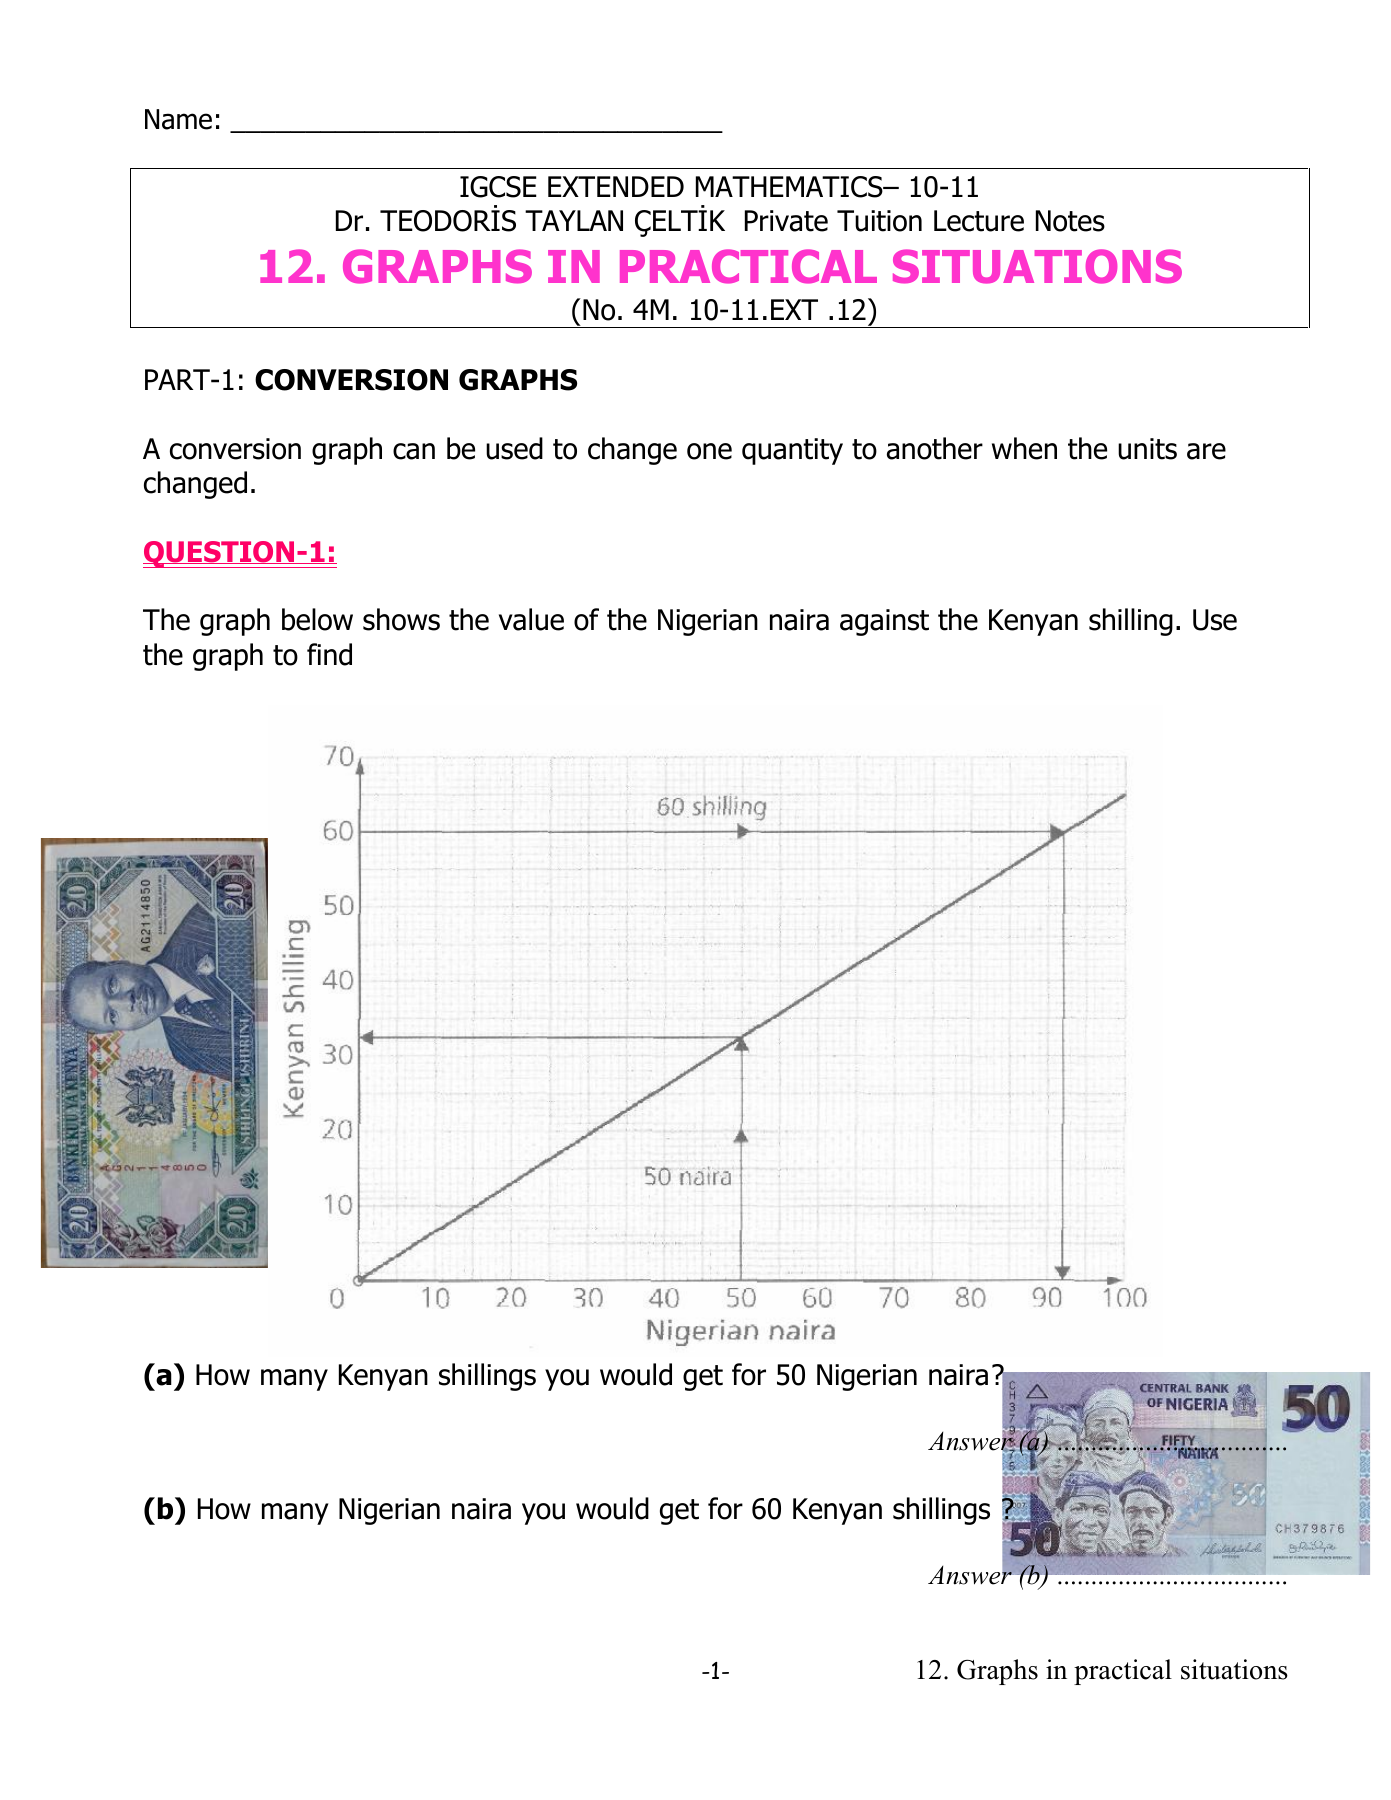
My original 22-page teaching booklet, supplied as an unchanged PDF. Conversion graphs, distance-time graphs, velocity-time graphs, rates and units.
The original questions, numbering, diagrams and page layout are preserved. This historical edition contains teaching notes, practice questions and selected answers. It is not a complete worked-solutions pack. Use the linked lesson description to see which questions that particular recording covers.
A separate one-page clarification PDF is included. Page 13 - Speed and velocity: Average speed is total distance divided by elapsed time. Average velocity is displacement divided by elapsed time. They agree when the motion remains in one direction. Page 13 - Question 12 scan and recording: The starting velocity label in the original scan appears to be 6 m/s, while the printed answer and the recording at about 40 minutes use 8 m/s. Do not infer the intended label from the answer. Taking the label as 6 gives displacement 45 m, average velocity 4.50 m/s and acceleration −0.4 m/s² over the first 5 s. Taking it as 8 gives 50 m, 5.00 m/s and −0.8 m/s². Acceleration over the final 5 s is zero in either case. Page 20 - Question 19(f): 29 ÷ 3 = 9.6666… km/h, so the answer is 9.67 km/h. The printed 0.967 km/h has a decimal-place error. Page 21 - Question 20(f): The requested unit is m/s: the speed is approximately 21.2 m/s. The alternative 76.4 km/h is equivalent after conversion, but is not in the requested unit.
Lessons with Dr Taylan Çeltik connect topics through a spiral learning approach.